Run123 Protocol & Analysis
Run123 uses an energy-based model, measurements, and math to solve for unknown parameters CdA, Crr, and elevation.
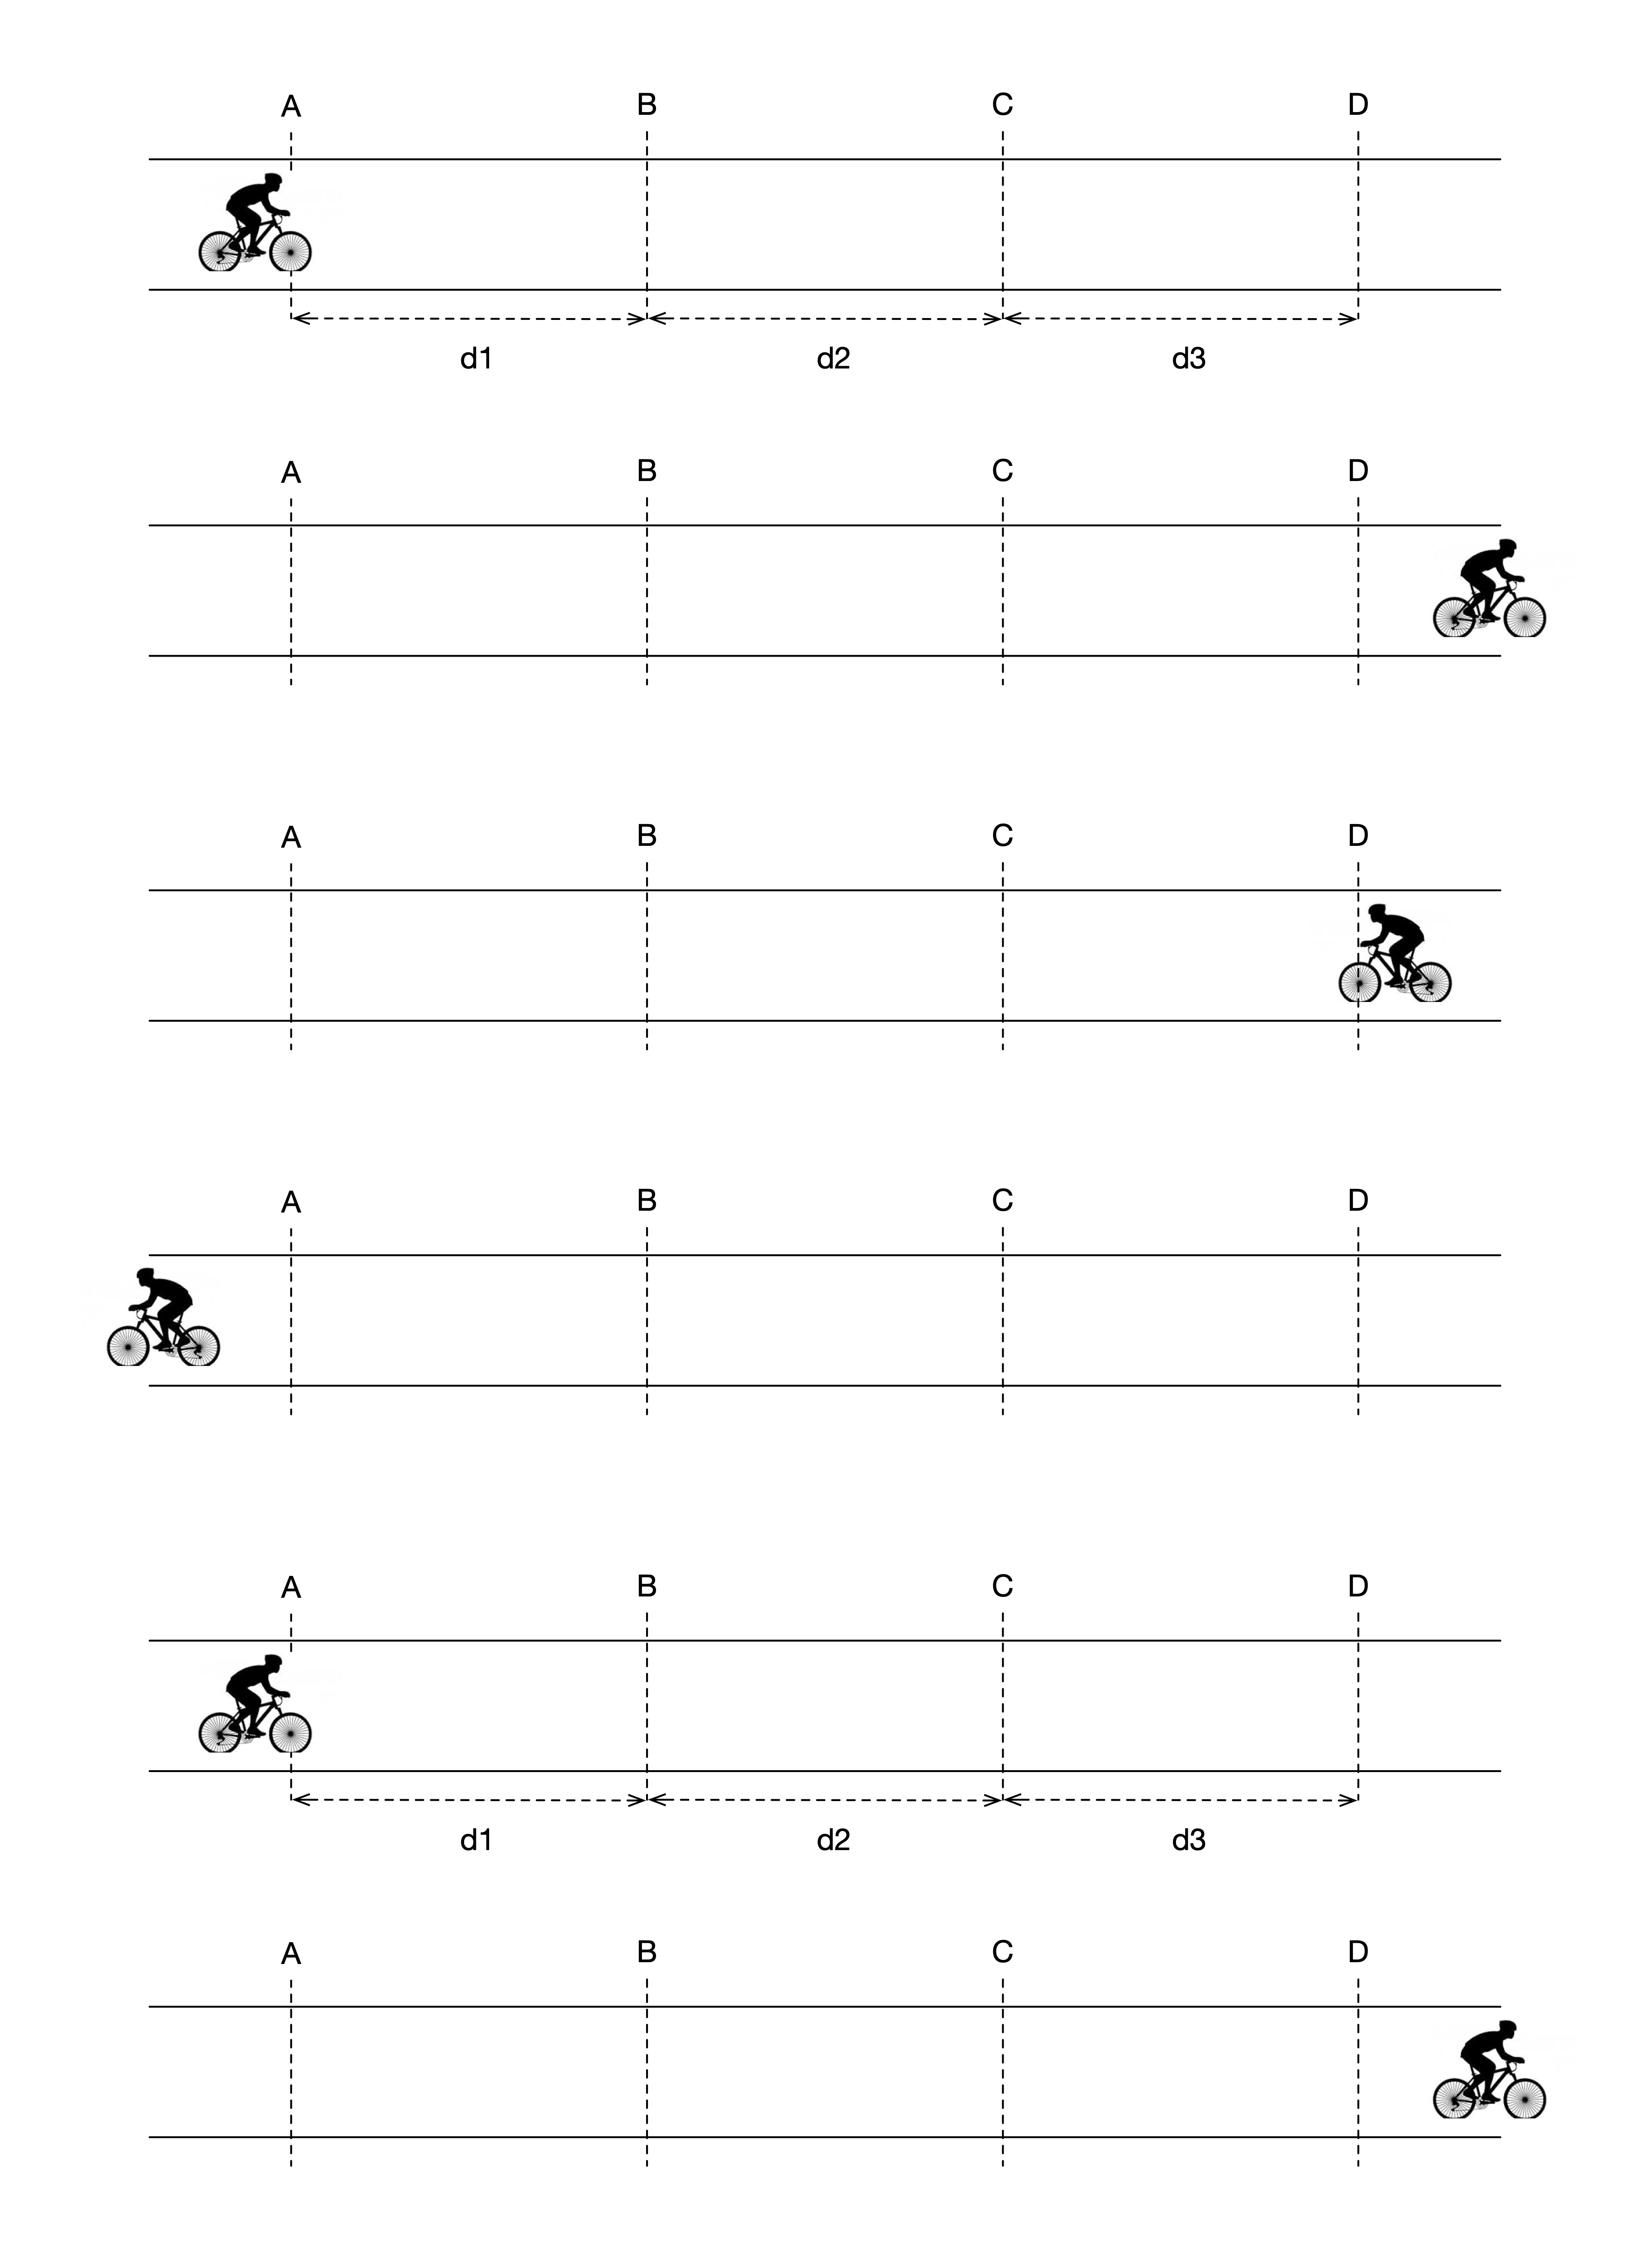
Since rolling resistance Crr and road slope behave similarly in the equations of motion, you need 2 runs in different directions to separate them.
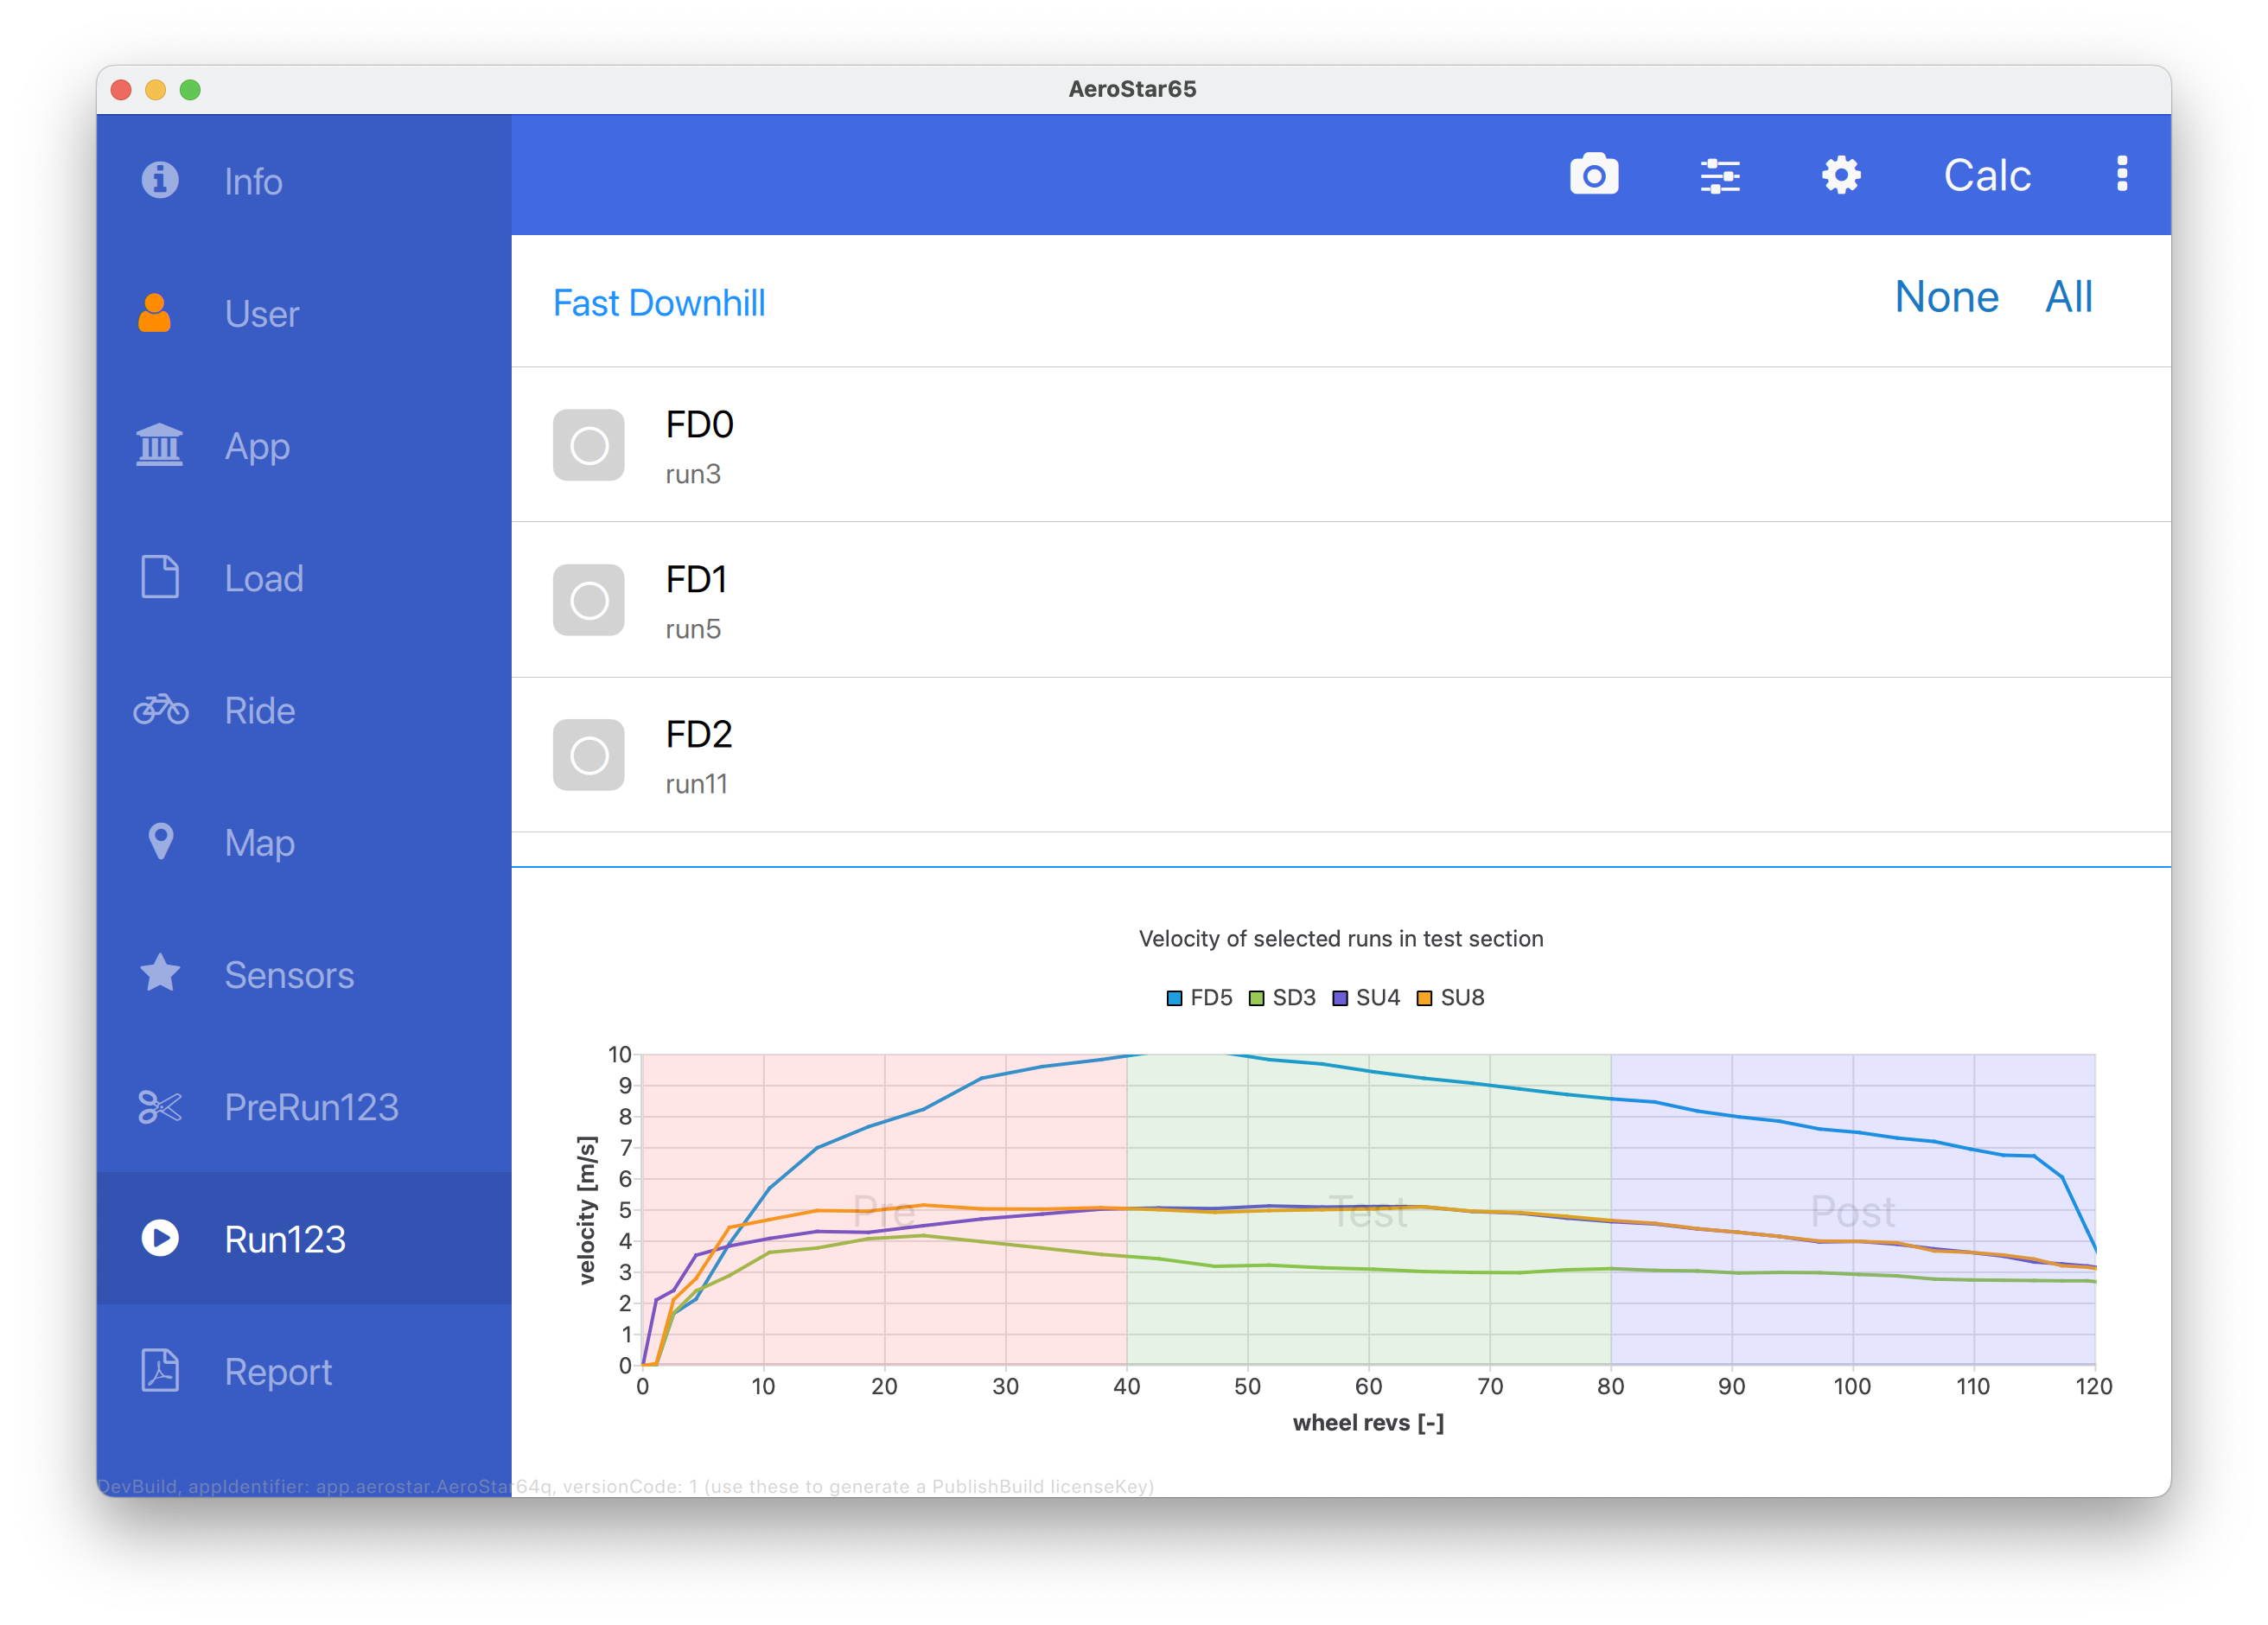
Since rolling resistance power is linearly dependent on velocity, and aero drag power has a cubic dependency, you need 2 runs with different speeds to separate them.
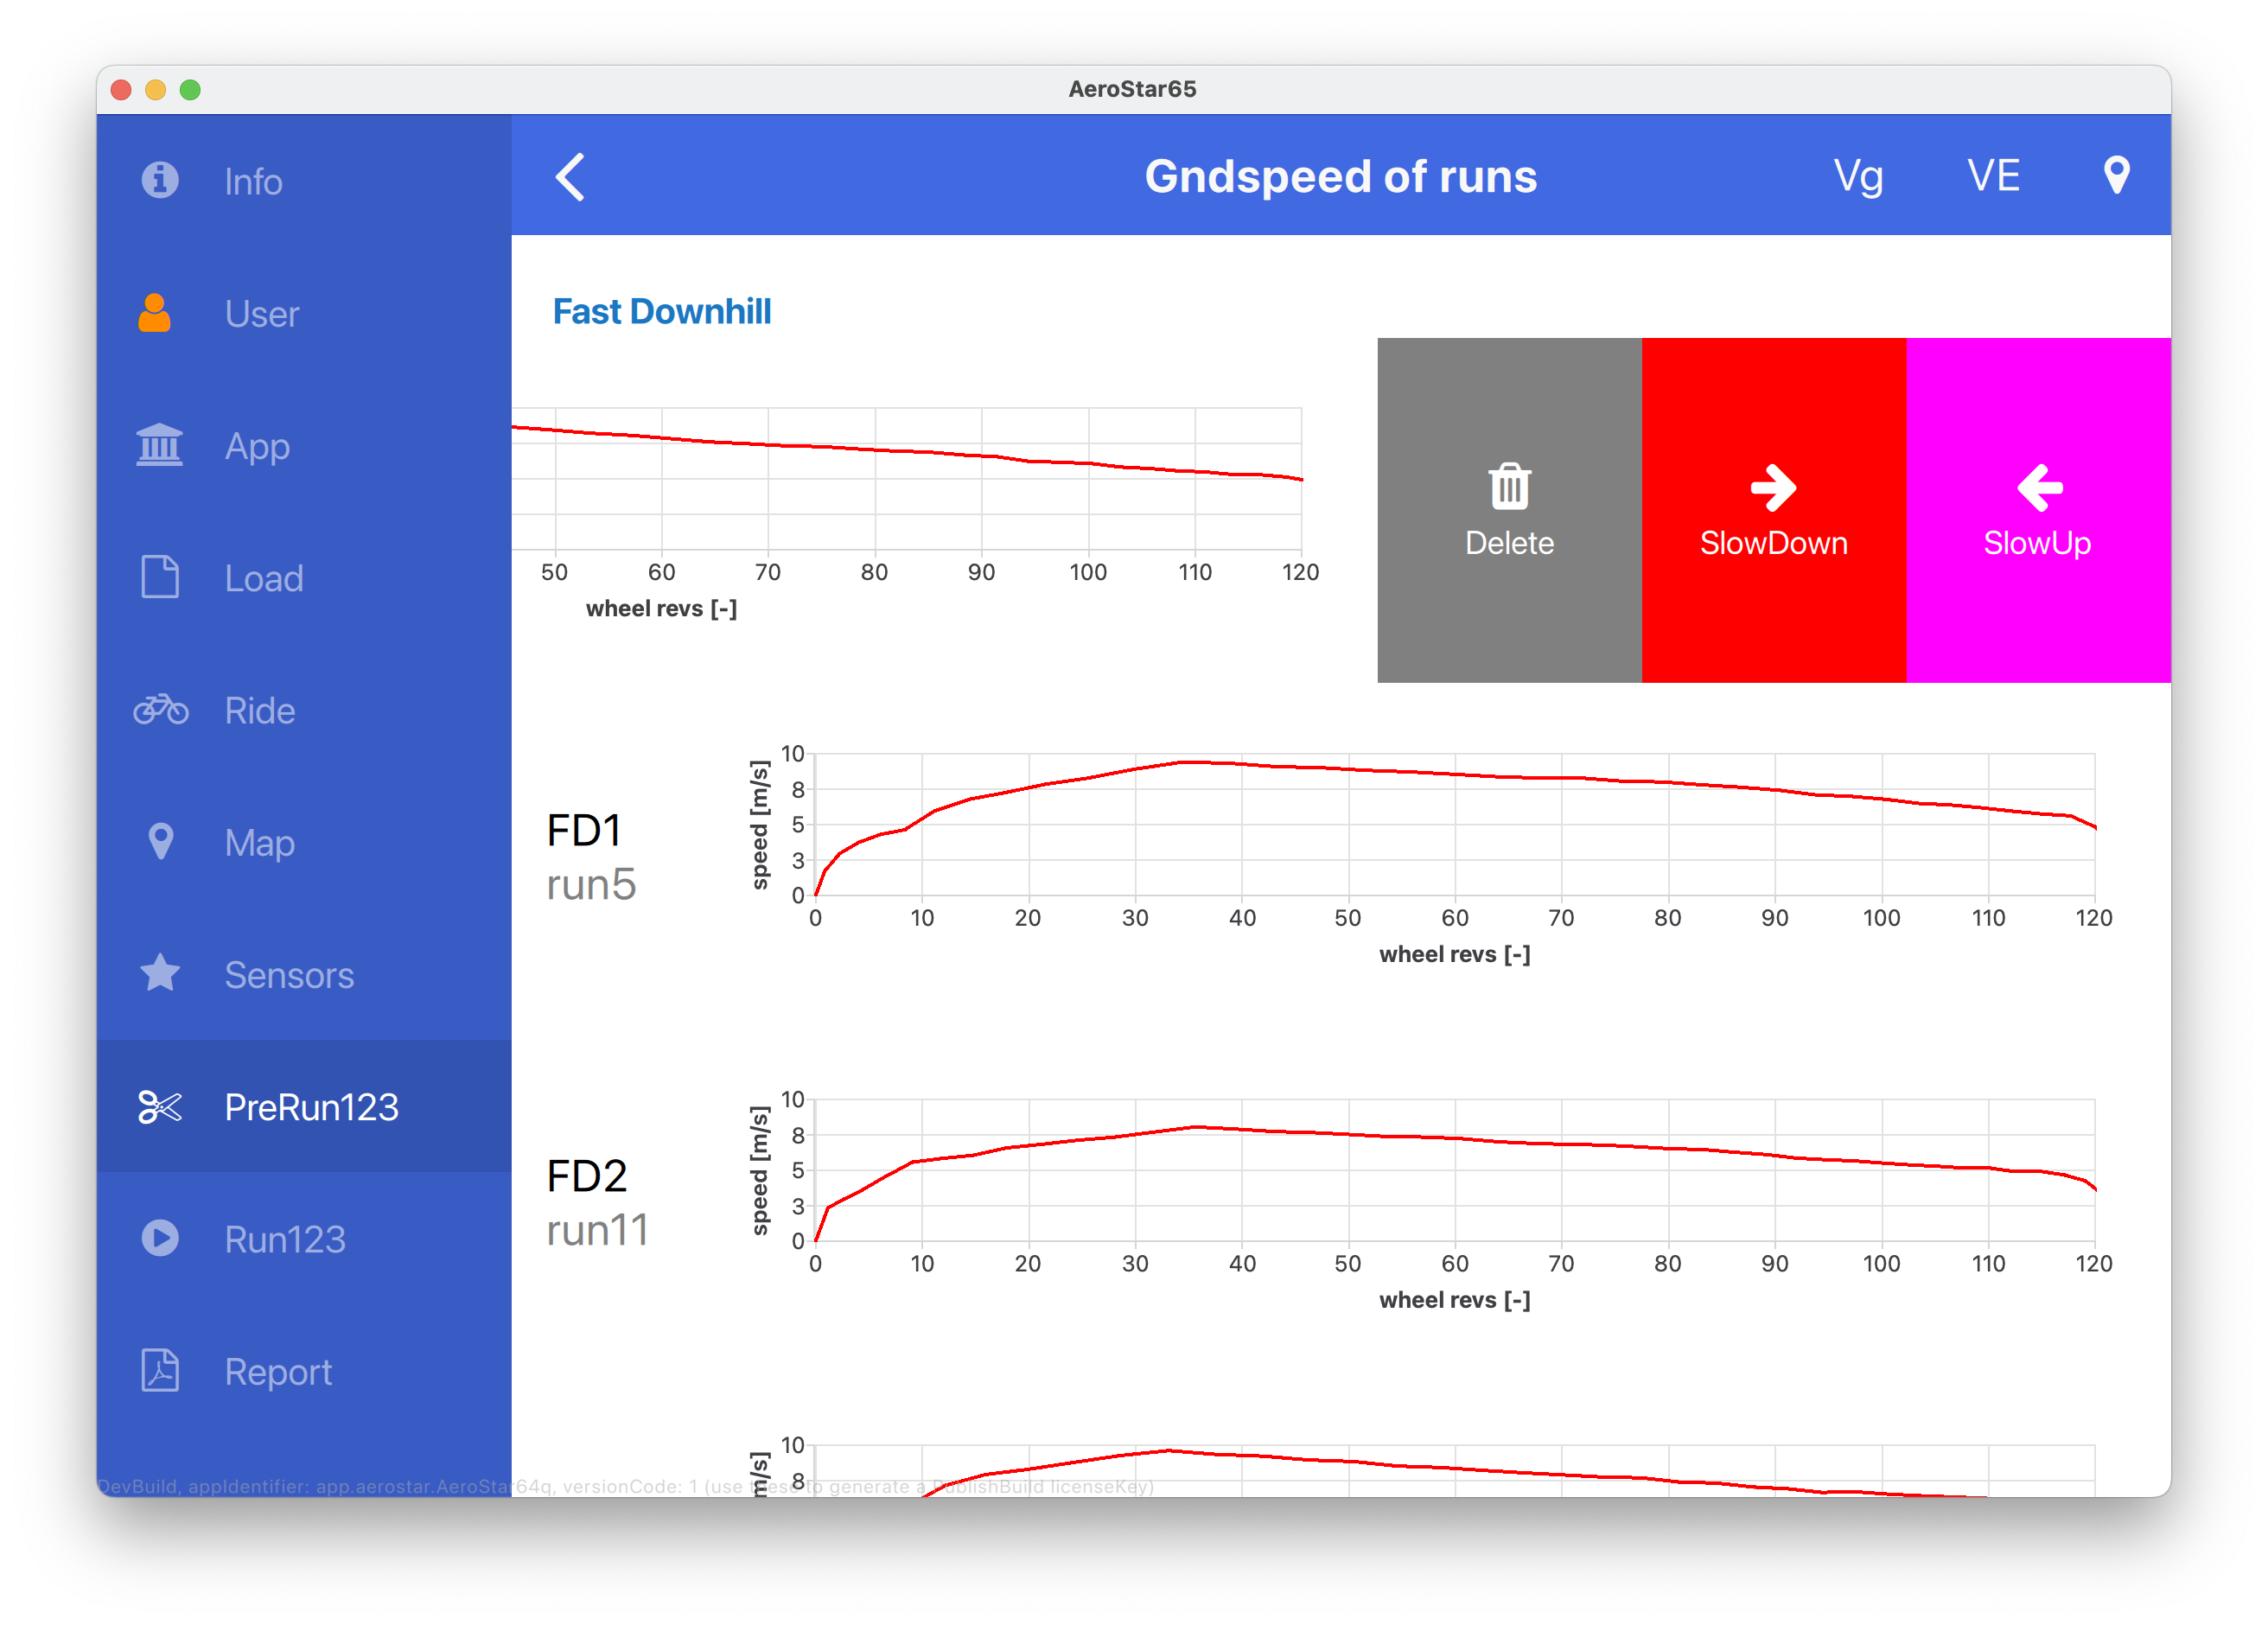
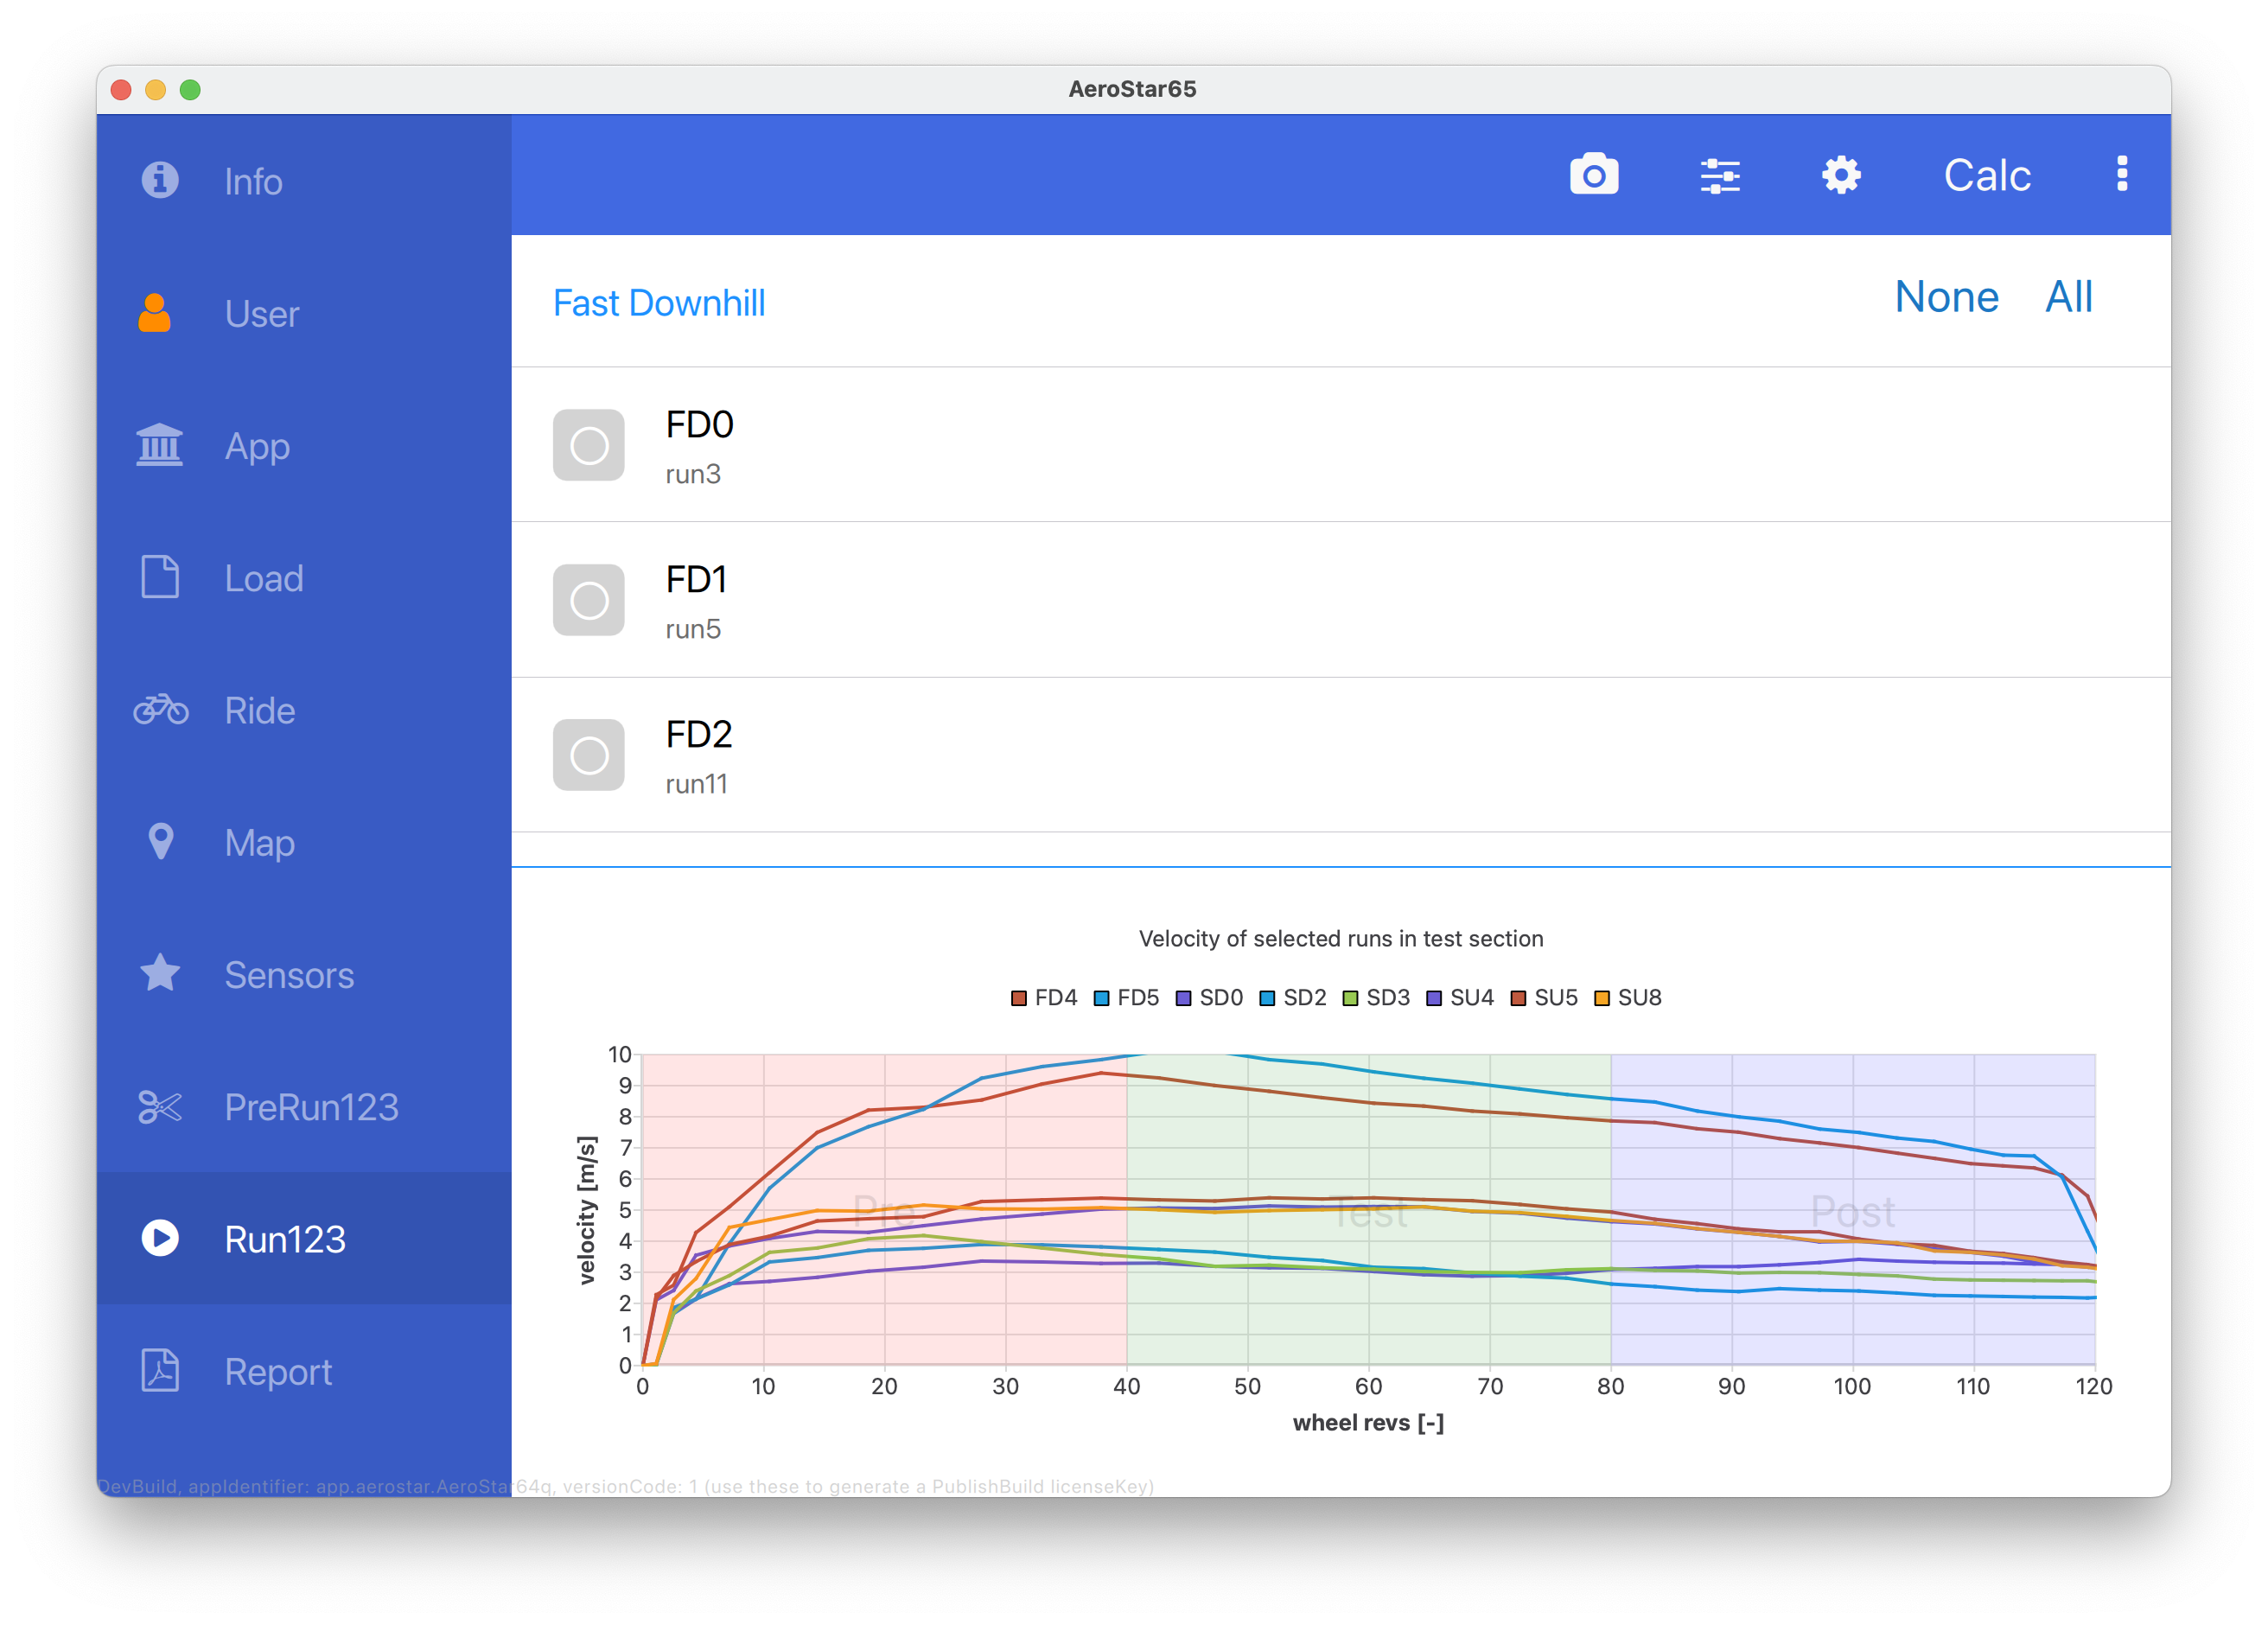
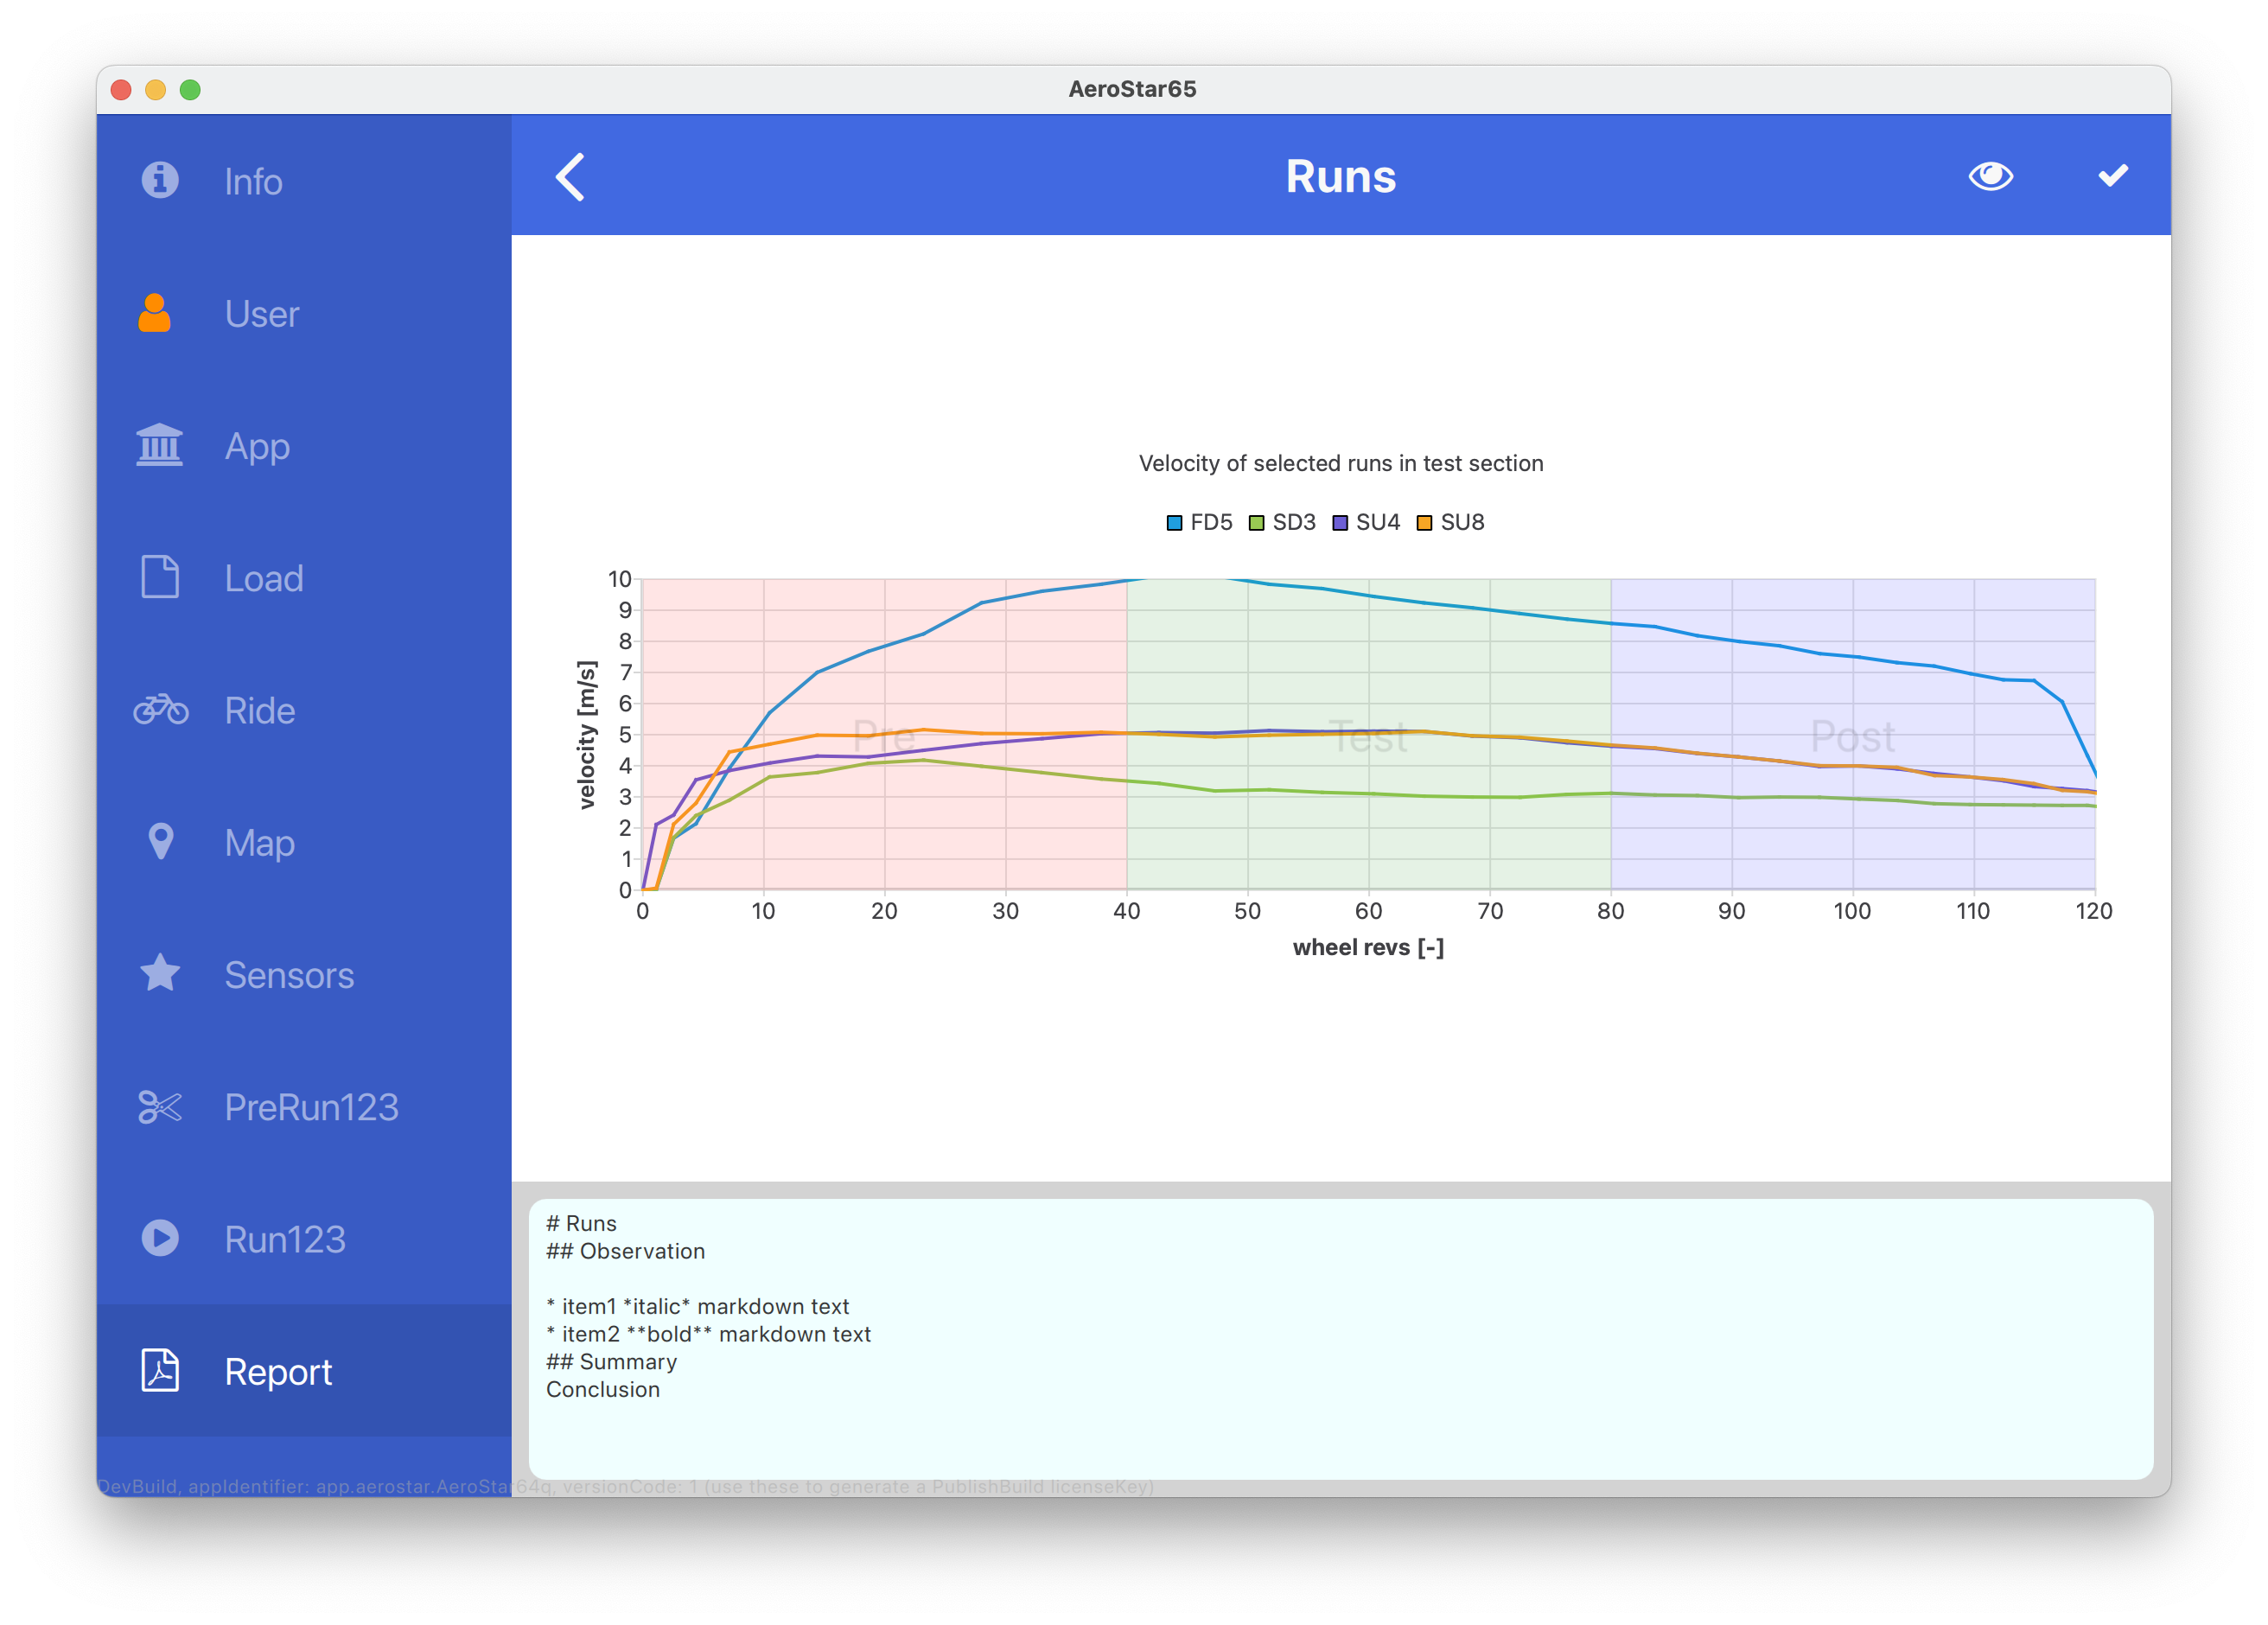
As a result you need at least 3 runs (Fast Downhill, Slow Downhill, Slow Uphill) to accurately estimate all the unknown parameters.
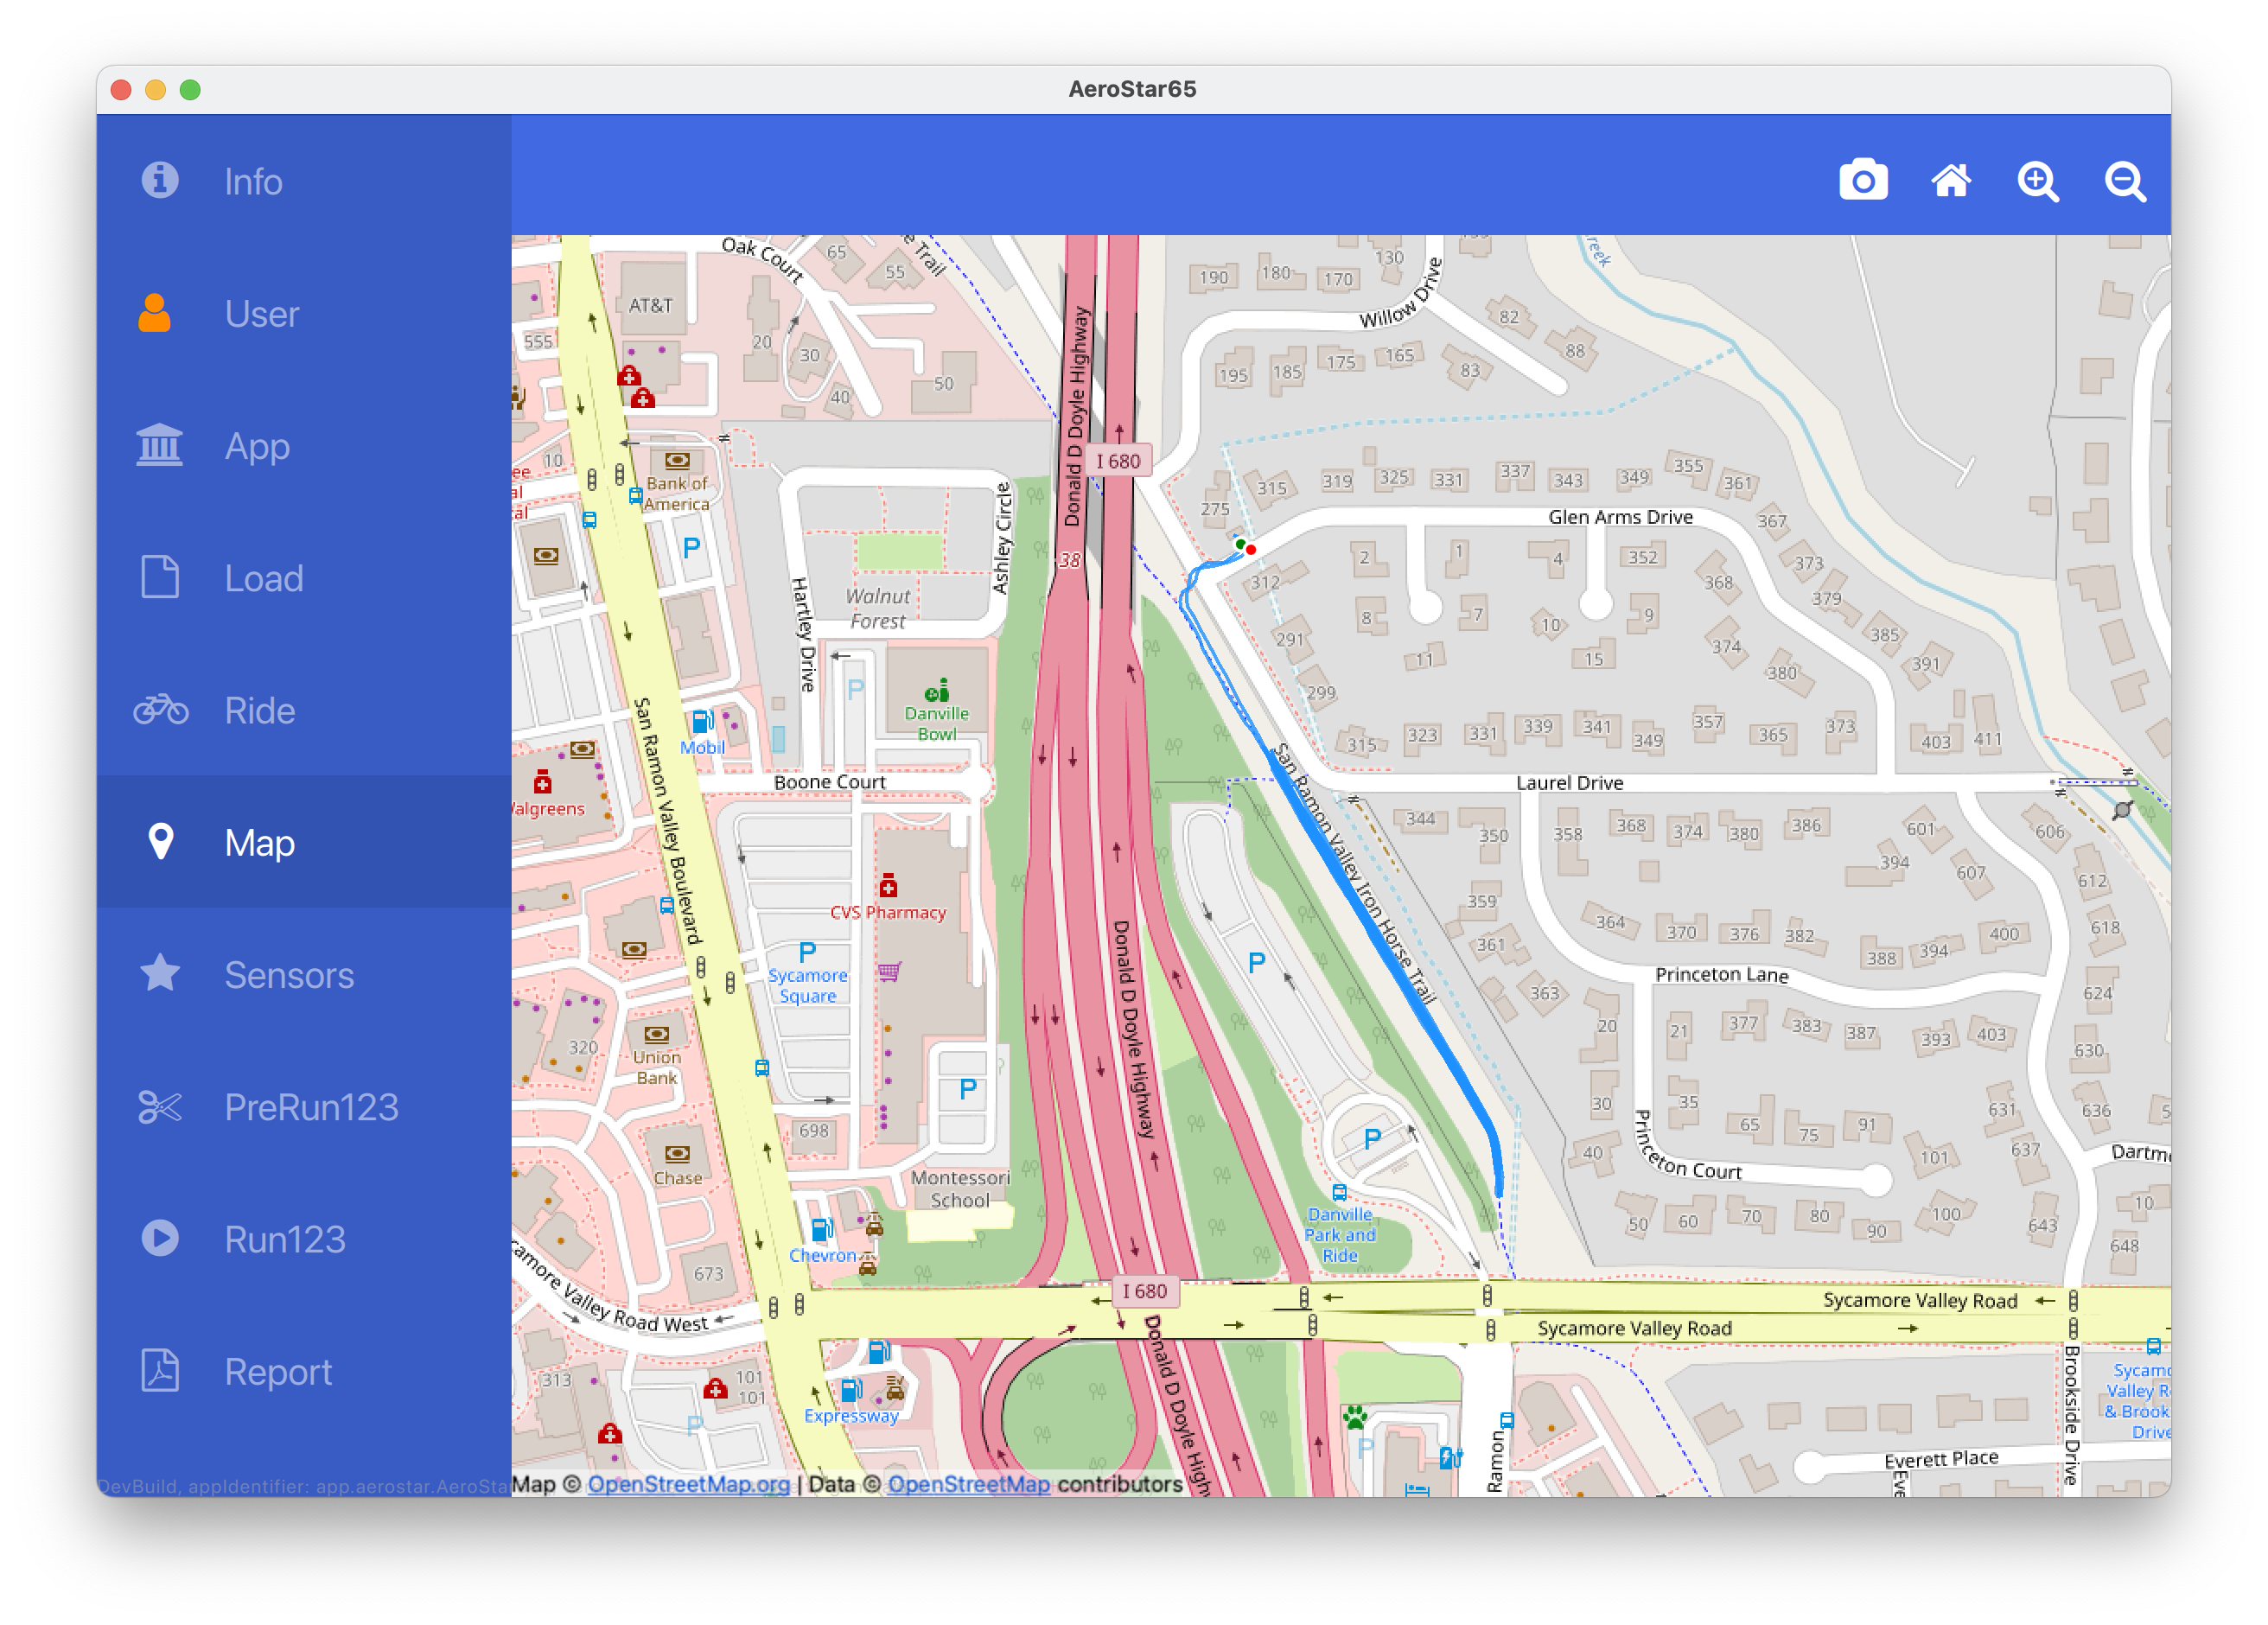
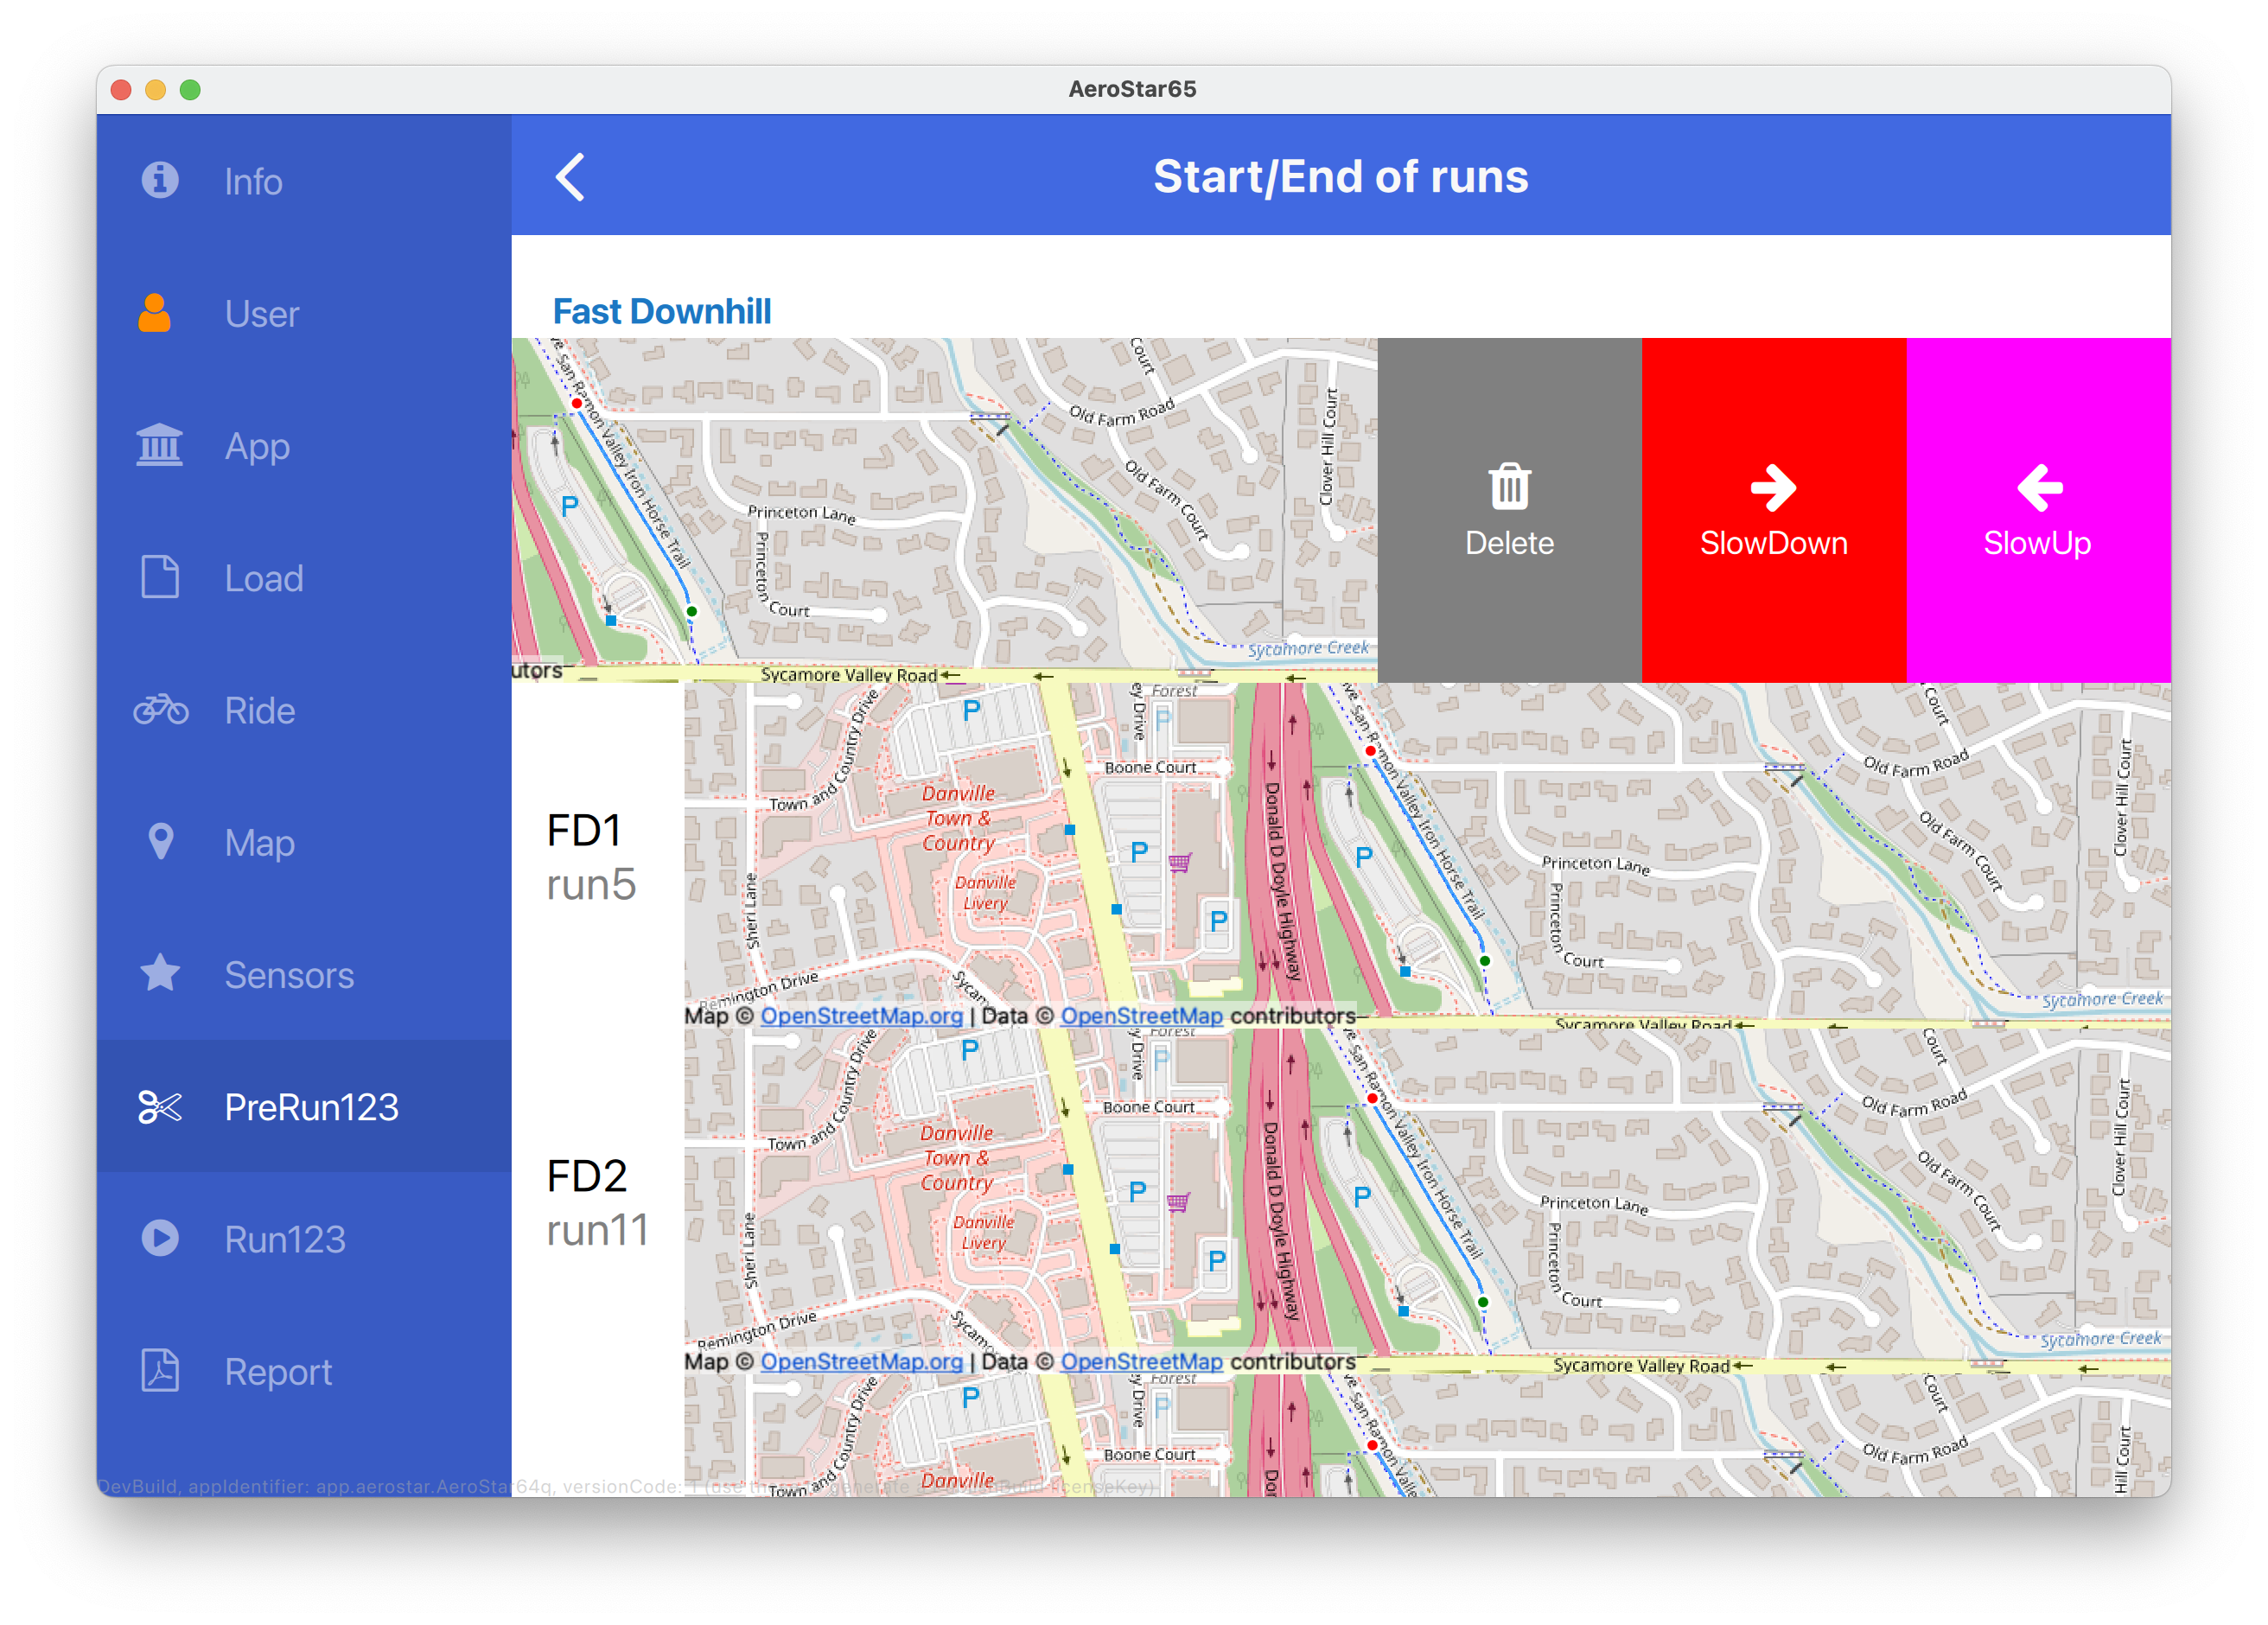
Every run follows the exact same path. A path slope of 0 to about -1% is perfect, small dips and bumps are ok. A path length of 60-100 meters is perfect. A bike path is perfect.
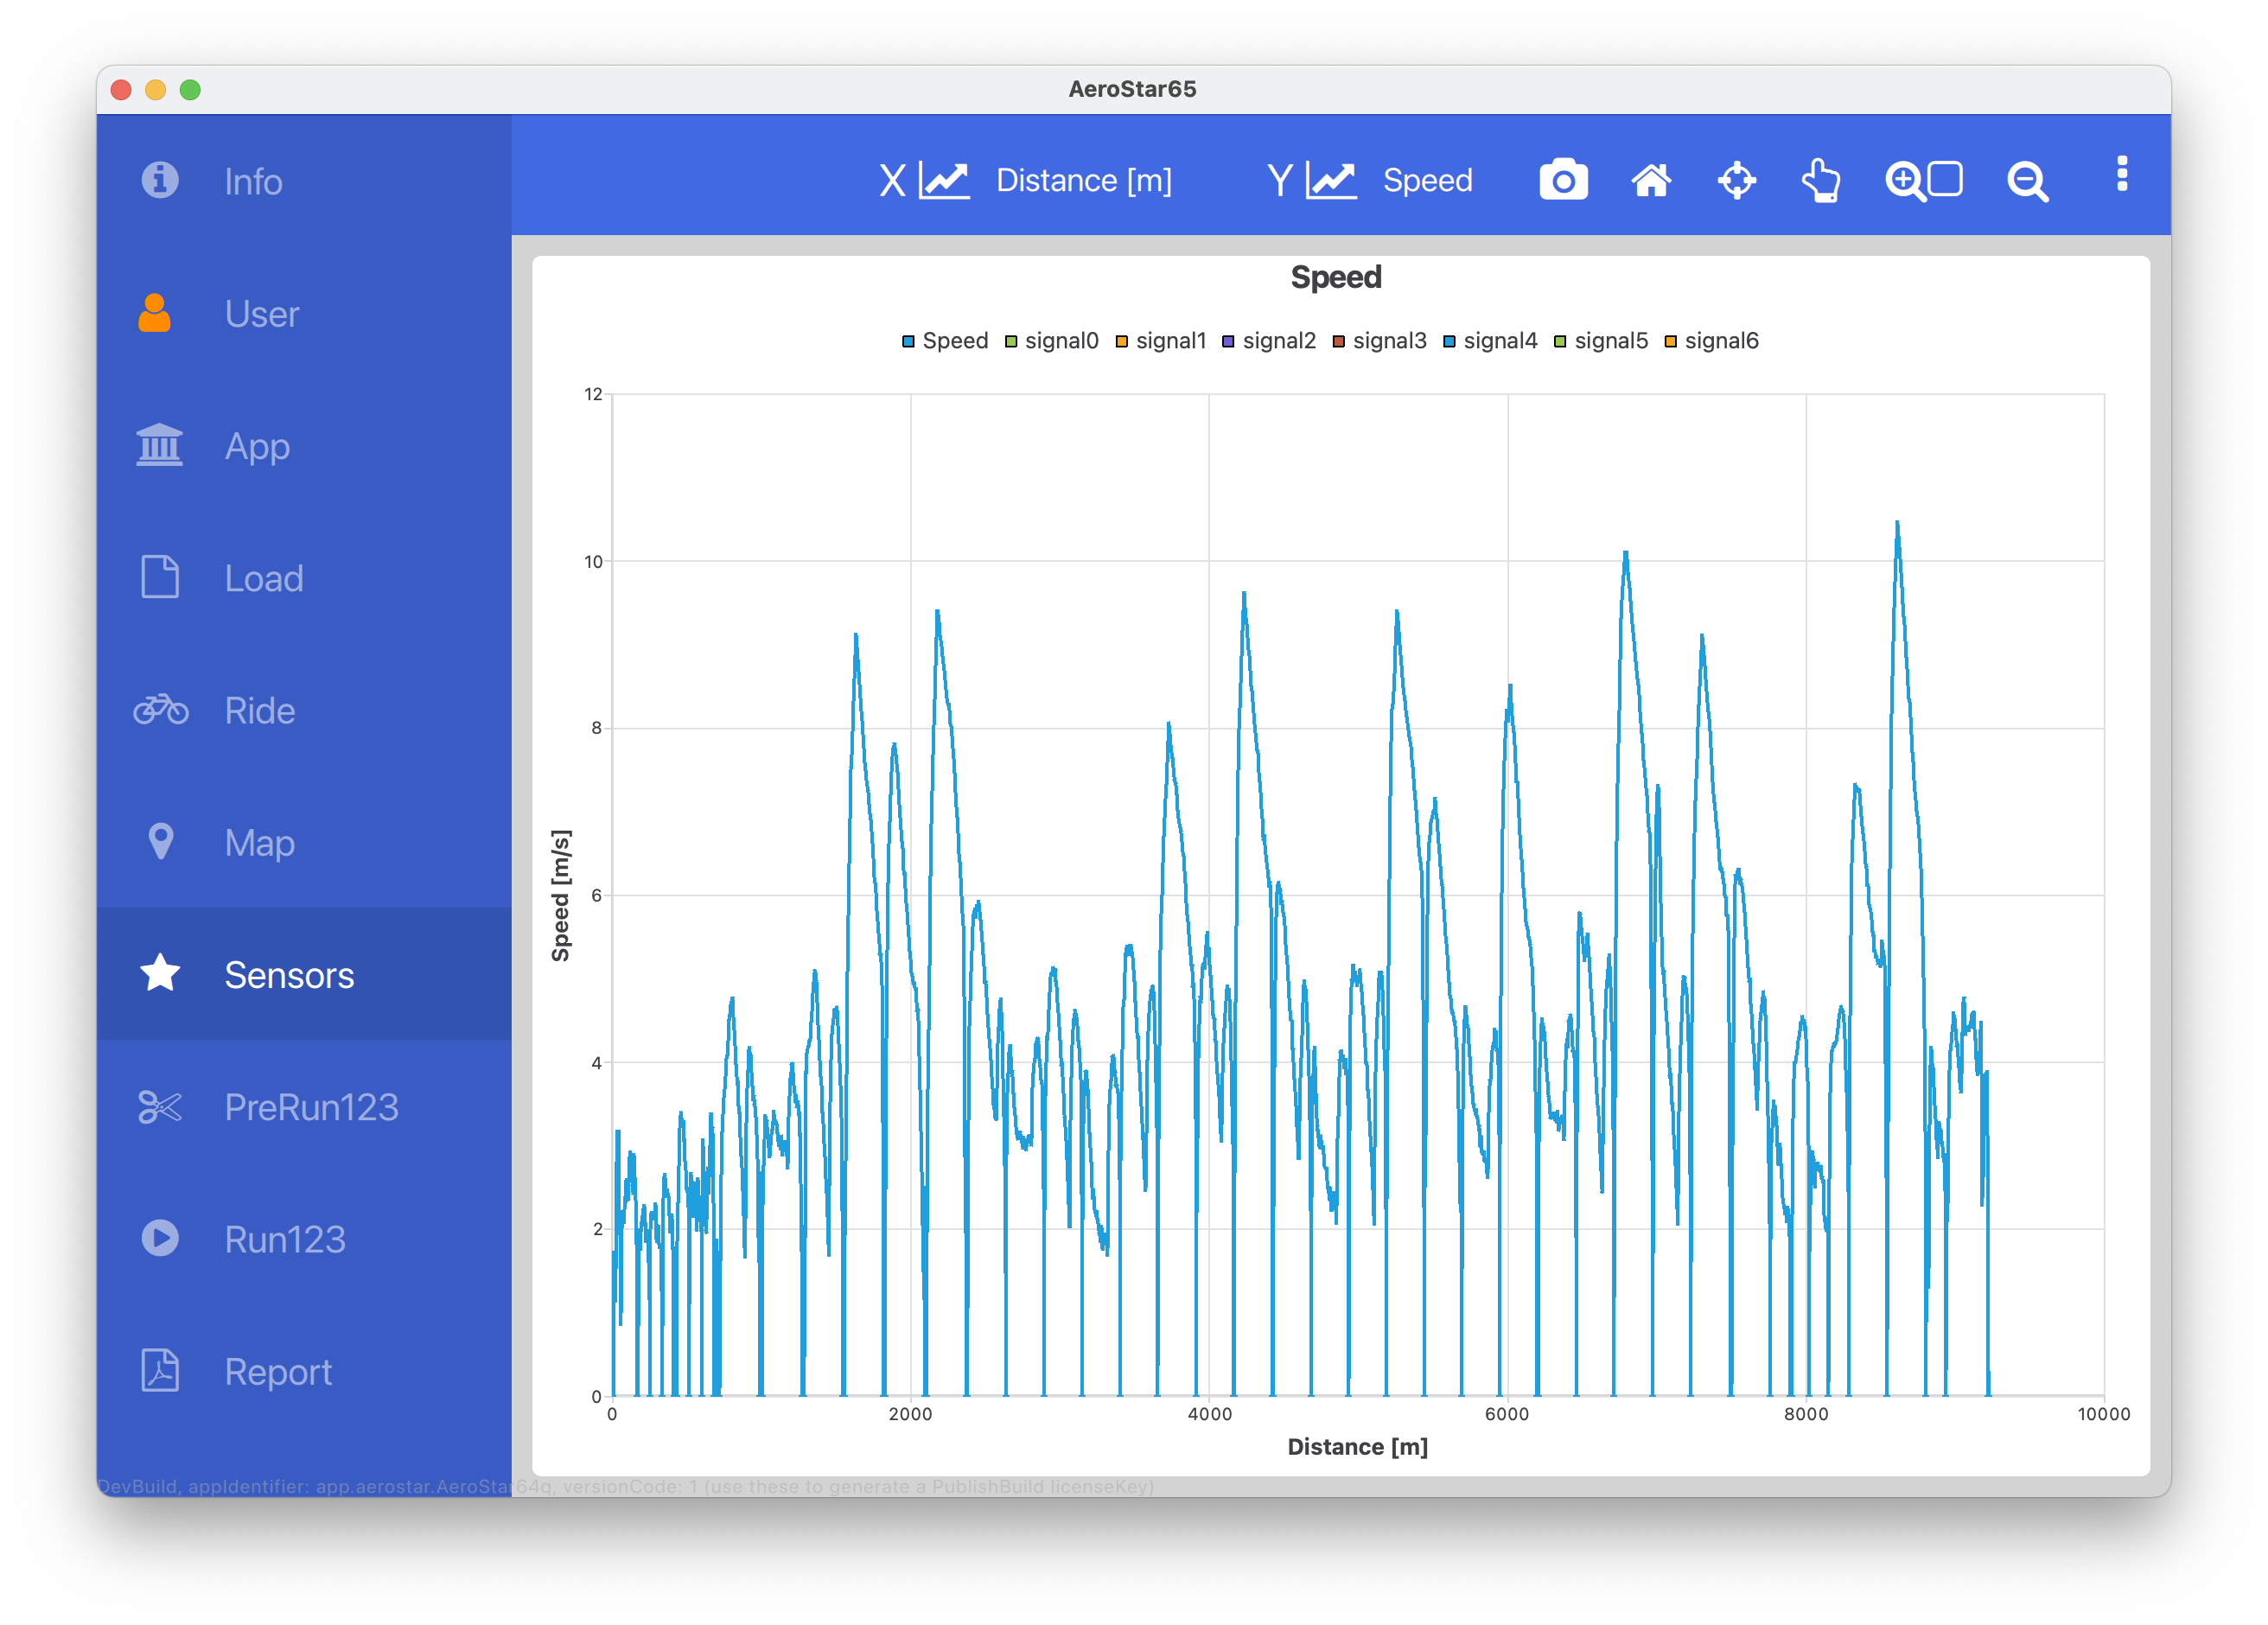
Since runs are short they each take less than 1 minute.
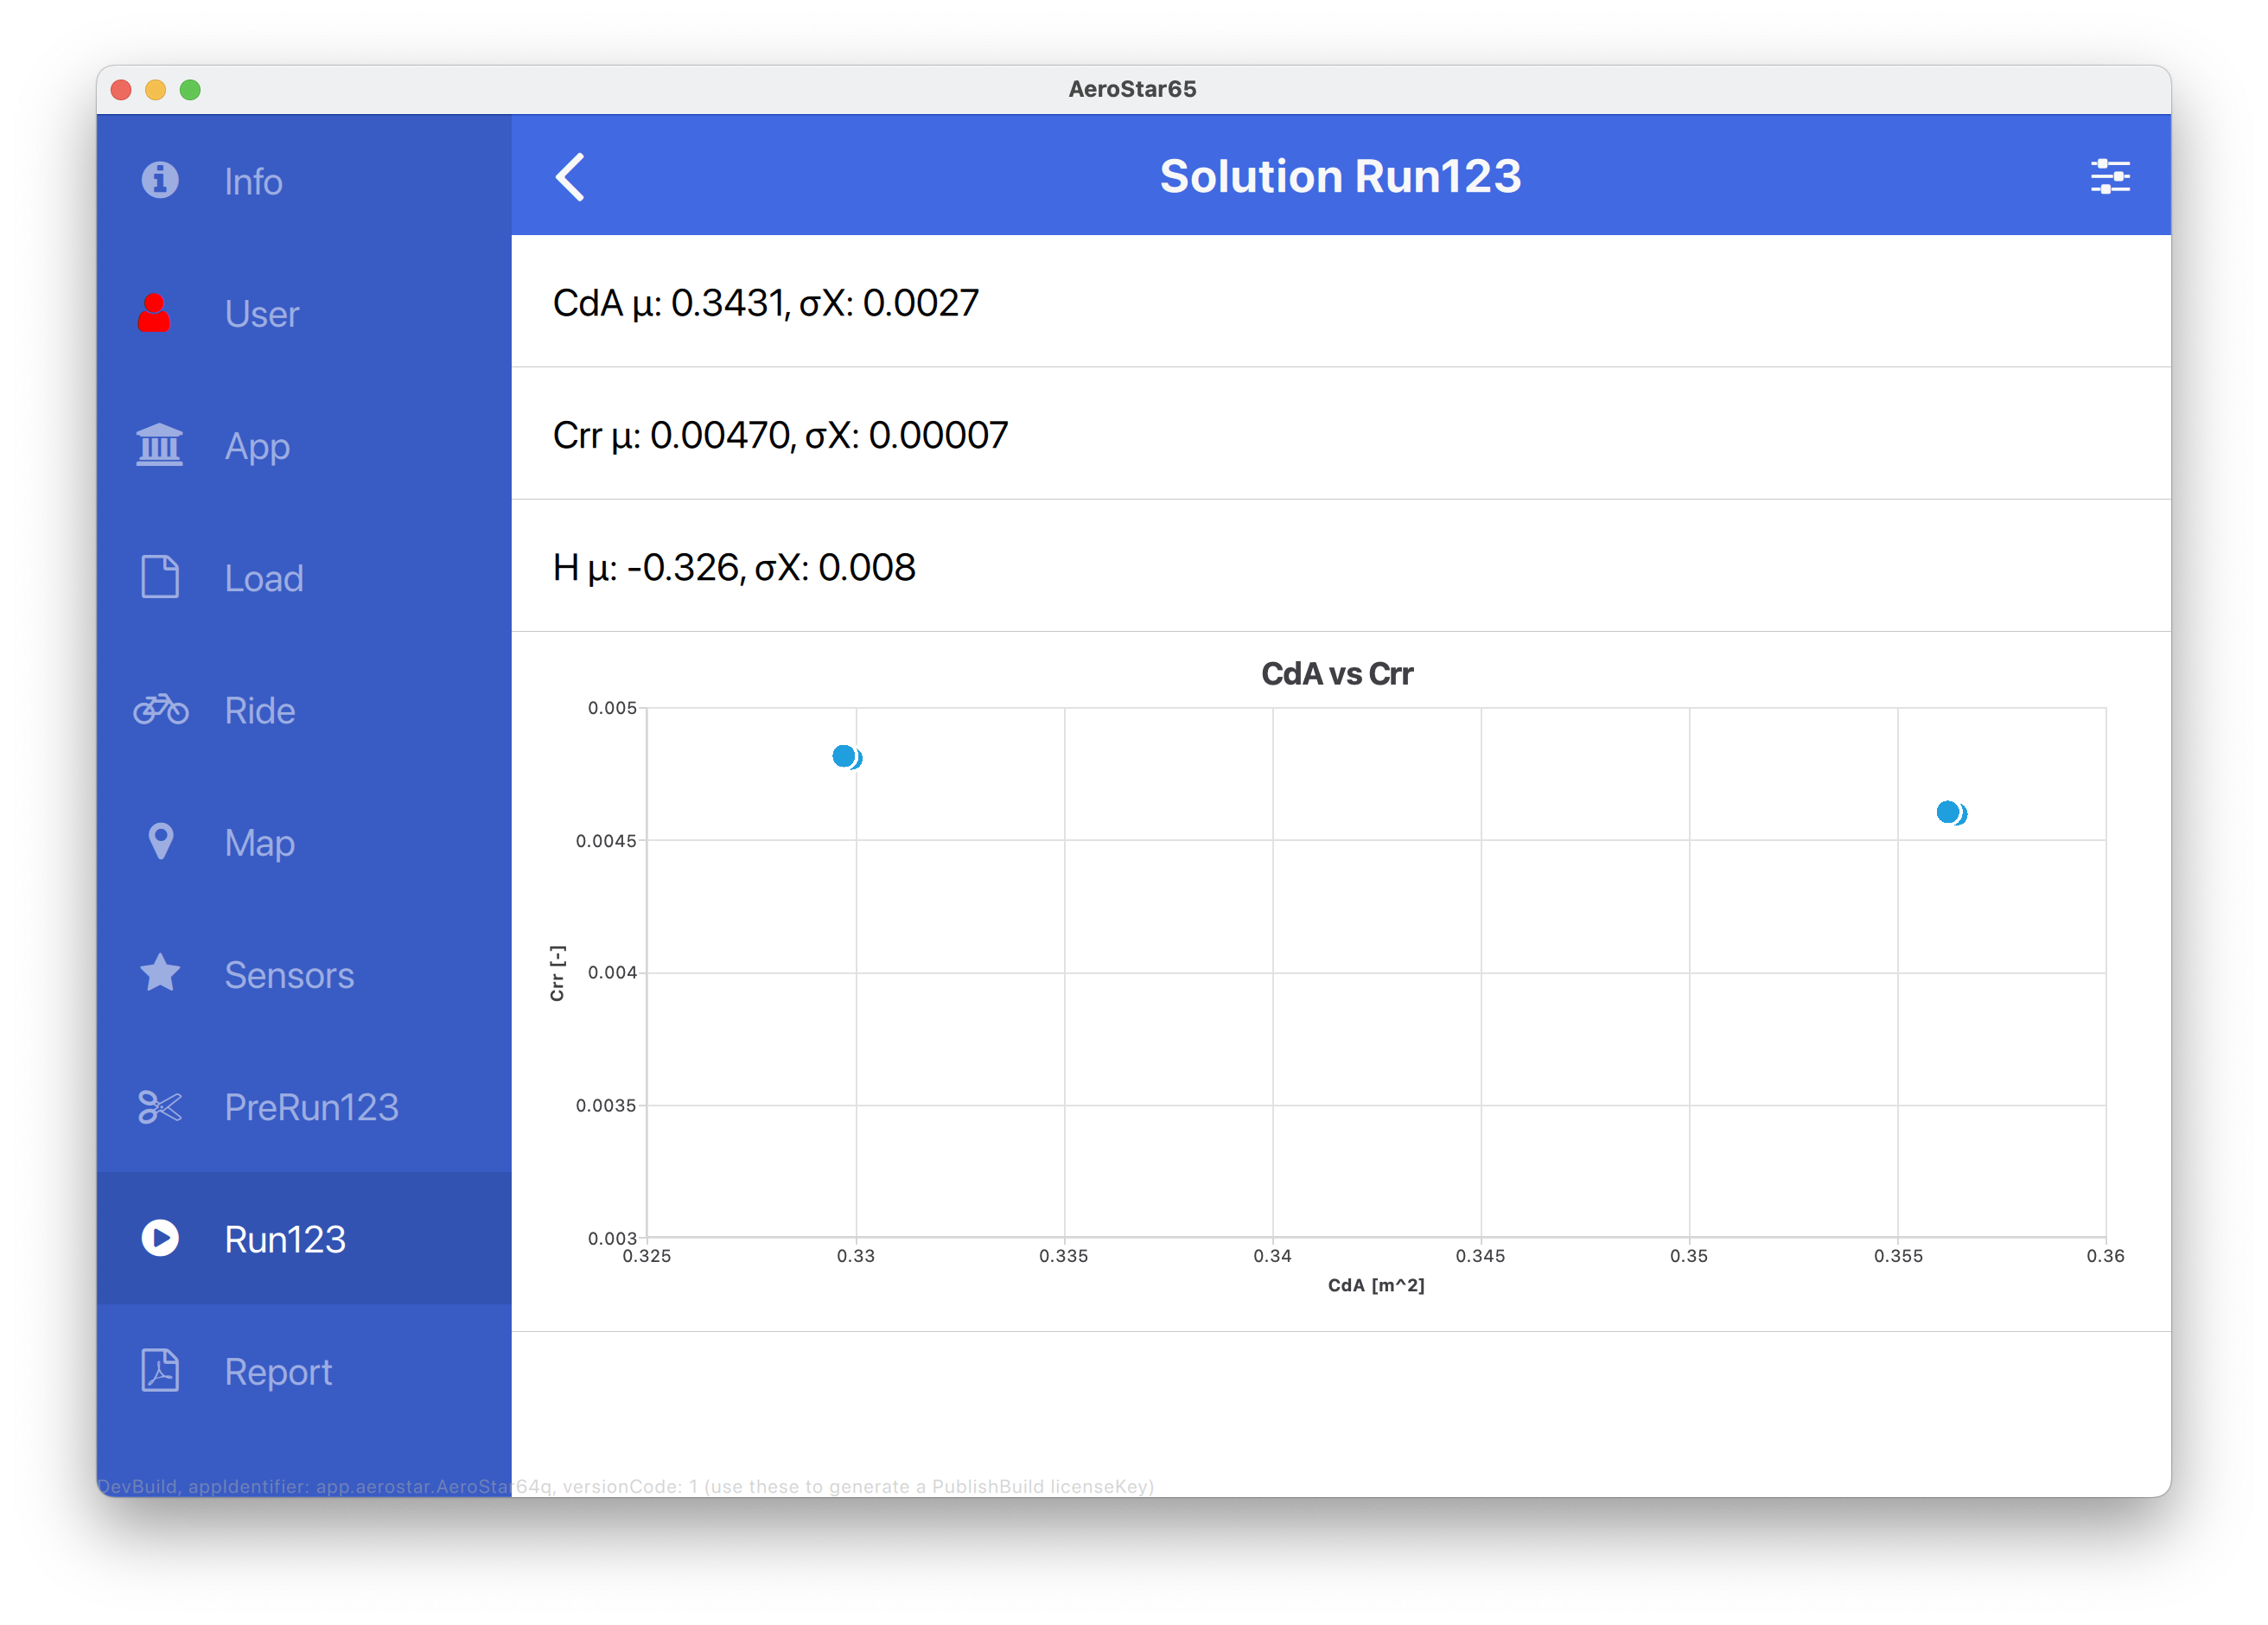
Using special solvers results in incredible high precision for both CdA and Crr!