RoadStar

Live Crr Analysis including vibrations from road roughness

RoadStar live Crr Analysis

RoadStar is a web-based app that runs in your browser. RoadStar reads Notio JSON files to calculate the cyclist's aerodynamic and rolling resistance using advanced mathematics.

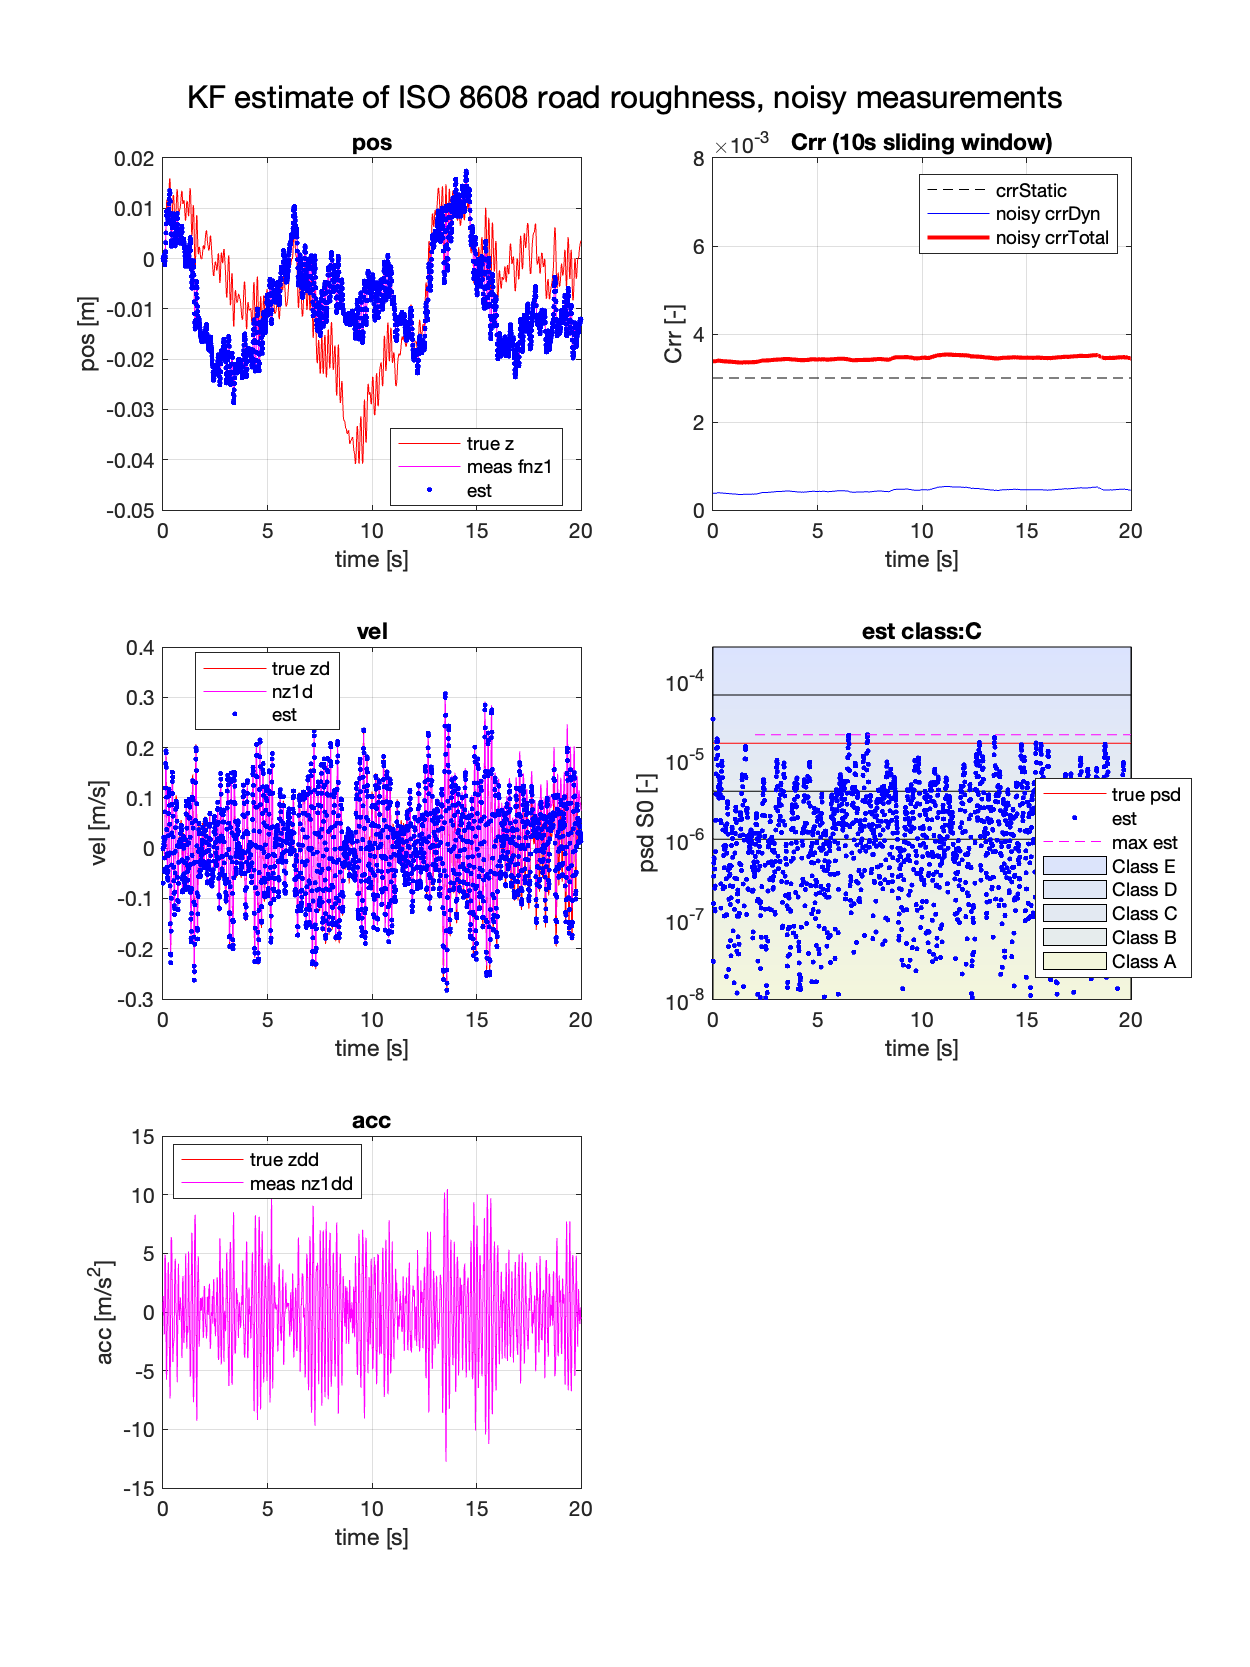
RoadStar analysis estimates the ISO 8608 road roughness from your accelerometer.

RoadStar estimates the total rolling resistance (Crr=Crr_static+Crr_dyn).

RoadStar calibrates you & your bike rolling over a standardized bump using system identifaction.

Live Crr due to Road Roughness

A rough road will start your bike vibrating and shaking. That energy is lost since it is dissipated by you! That lost energy increases the rolling resistance.

Prior art methods use spectral methods (FFT, PSD) to analyze the vibrations. Today RoadStar uses Kalman Filters to model the unknown road characteristics and compute the effective rolling resistance.

As a bonus, RoadStar estimates the ISO 8608 road roughness.

Features & Benefits

Feature

Benefit

Web-app
An easy to use automated analysis environment. Runs in your desktop browser! No installation. Automatic updates.
Easy-to-use
Automated analyses -- no manual settings or slider adjustments. Simply load your ride, look at your CdA graph, and double-check the validation graphs!
High accuracy algorithms
Provably correct Crr when analyzing rides which have analytical results.
Kalman Filter estimates
AeroStar uses Kalman Filters (aka optimal observers) to estimate the unknown Crr parameter. With more data the estimates become more & more precise, and the accuracy is reported.
Kalman Filter replaces expensive sensors with math
Kalman Filters optimally combine a model of the dynamic system and (noisy) measurements. Often it is difficult or expensive or impossible to use sensors to accurately measure the system -- looking at you Body Rocket! -- instead Kalman Filters replace sensors with math!
Loads Notio files
Instant analysis using Notio sensor data. Some data (mass, density, elevation, airspeed) can be optionally modified.
Map of the ride
A map shows the path of the ride. The starting and ending points are marked. Customizeable map type and zoom.
Graphs of primary sensor data
Quick sanity check -- do power, elevation, ground speed and airspeed all look good?
Graphs of any sensor or computed data
Zoom in and explore all the data available in your ride. Zoom to-fit or Zoom rectangle to look at detail.
Real-time Crr analysis
Kalman Filter-based analysis estimates real-time Crr (Notio 4Hz) instead of a lap-average.
PDF Reports
Include any graph in a PDF report as ride summary.