Click the big green button above to start AeroStar in your browser.
On the left hand side is a vertical menu. Click the "Load" tab.
You'll see several built-in demo files. Click the first Notio demo file (Out & Back, 1 lap).
A checkmark appears to show that the ride has been loaded and analyzed. To continue click the "Map" tab.
The "Map" tab shows a map of the ride with start (green) and end (red) location and the ride path (blue). To continue click "Sensors".
The "Sensors" tab shows 2x2 graphs of the major sensors including power, elevation, ground speed and air speed. To continue click the "CdA & More" tab.
The "CdA&More" tab graphs the selected data (defaults to CdA). The CdA graphs for AerostarM2 and Notio are shown. Use the icon buttons in the top-right to zoom in/out. Use the eye icons to hide/show individual graphs. Use the home icon to zoom-to-fit.
Click the "CdA" button to open popup menus to graph other data. For example click "Sensors>Density" and explore.
Click the "Validation" tab to show 2x2 validation graphs including Energy, Virtual Elevation, Virtual Power, and Virtual Velocity. If the CdA is accurate than all validation graphs should match measured values. Press the radio buttons at the top to switch between AerostarM2 and Notio results. Note that the AeroStar VE closely matches the measured elevation, but the Notio VE is tens of meters too high = the Notio CdA is too low.
Note the 2x2 validation graphs can be graphed individually in the "CdA&More" tab by selecting "Validation" in the popup menu.
At the top of each page you will see a camera icon. This saves a screenshot of the current graph into a report list.
Click the "Report" tab to see a list of report items. Click an item to edit the item. Swipe to delete. Press up/down buttons to change the order. Press the PDF icon at the top-right to generate a PDF report.
Click the big green button above to start AeroStar in your browser.
Click the big green button above to start AeroStar in your browser.
On the left hand side is a vertical menu. Click the "Load" tab.
You'll see several built-in demo files. Click the third Notio demo file (velodrome, 6x7 laps).
A checkmark appears to show that the ride has been loaded and analyzed. To continue click the "Sensors" tab.
The "Sensors" tab shows 2x2 graphs of the major sensors including power, elevation, ground speed and air speed. Note that the elevation has a weather-related trend. Let's fix that, go back to "Load"
On the "Load" page click the "Options" button in the top-right to open a popup menu. Select "Elevation>Velodrome" to force the elevation to zero.
Click the "Sensors" tab, note the flat elevation.
Click the "CdA & More" tab to see AeroStar M2, M4 and Notio CdA curves. Use the zoom-rect icon to zoom in on a section of the M4 CdA. Note that AeroStar shows that the competitive rider holds a CdA between 0.170 and 0.175 for all laps. Notio shows a CdA between 0 and 1.
Click the "CdA" button and select "Validation>Crrs" from the popup menu to see the AeroStar M4 calculated Crr~0.0043.
How do I try AeroStar analysis on my own Notio files?
Click the big green button above to start AeroStar in your browser.
Click the big green button above to start AeroStar in your browser.
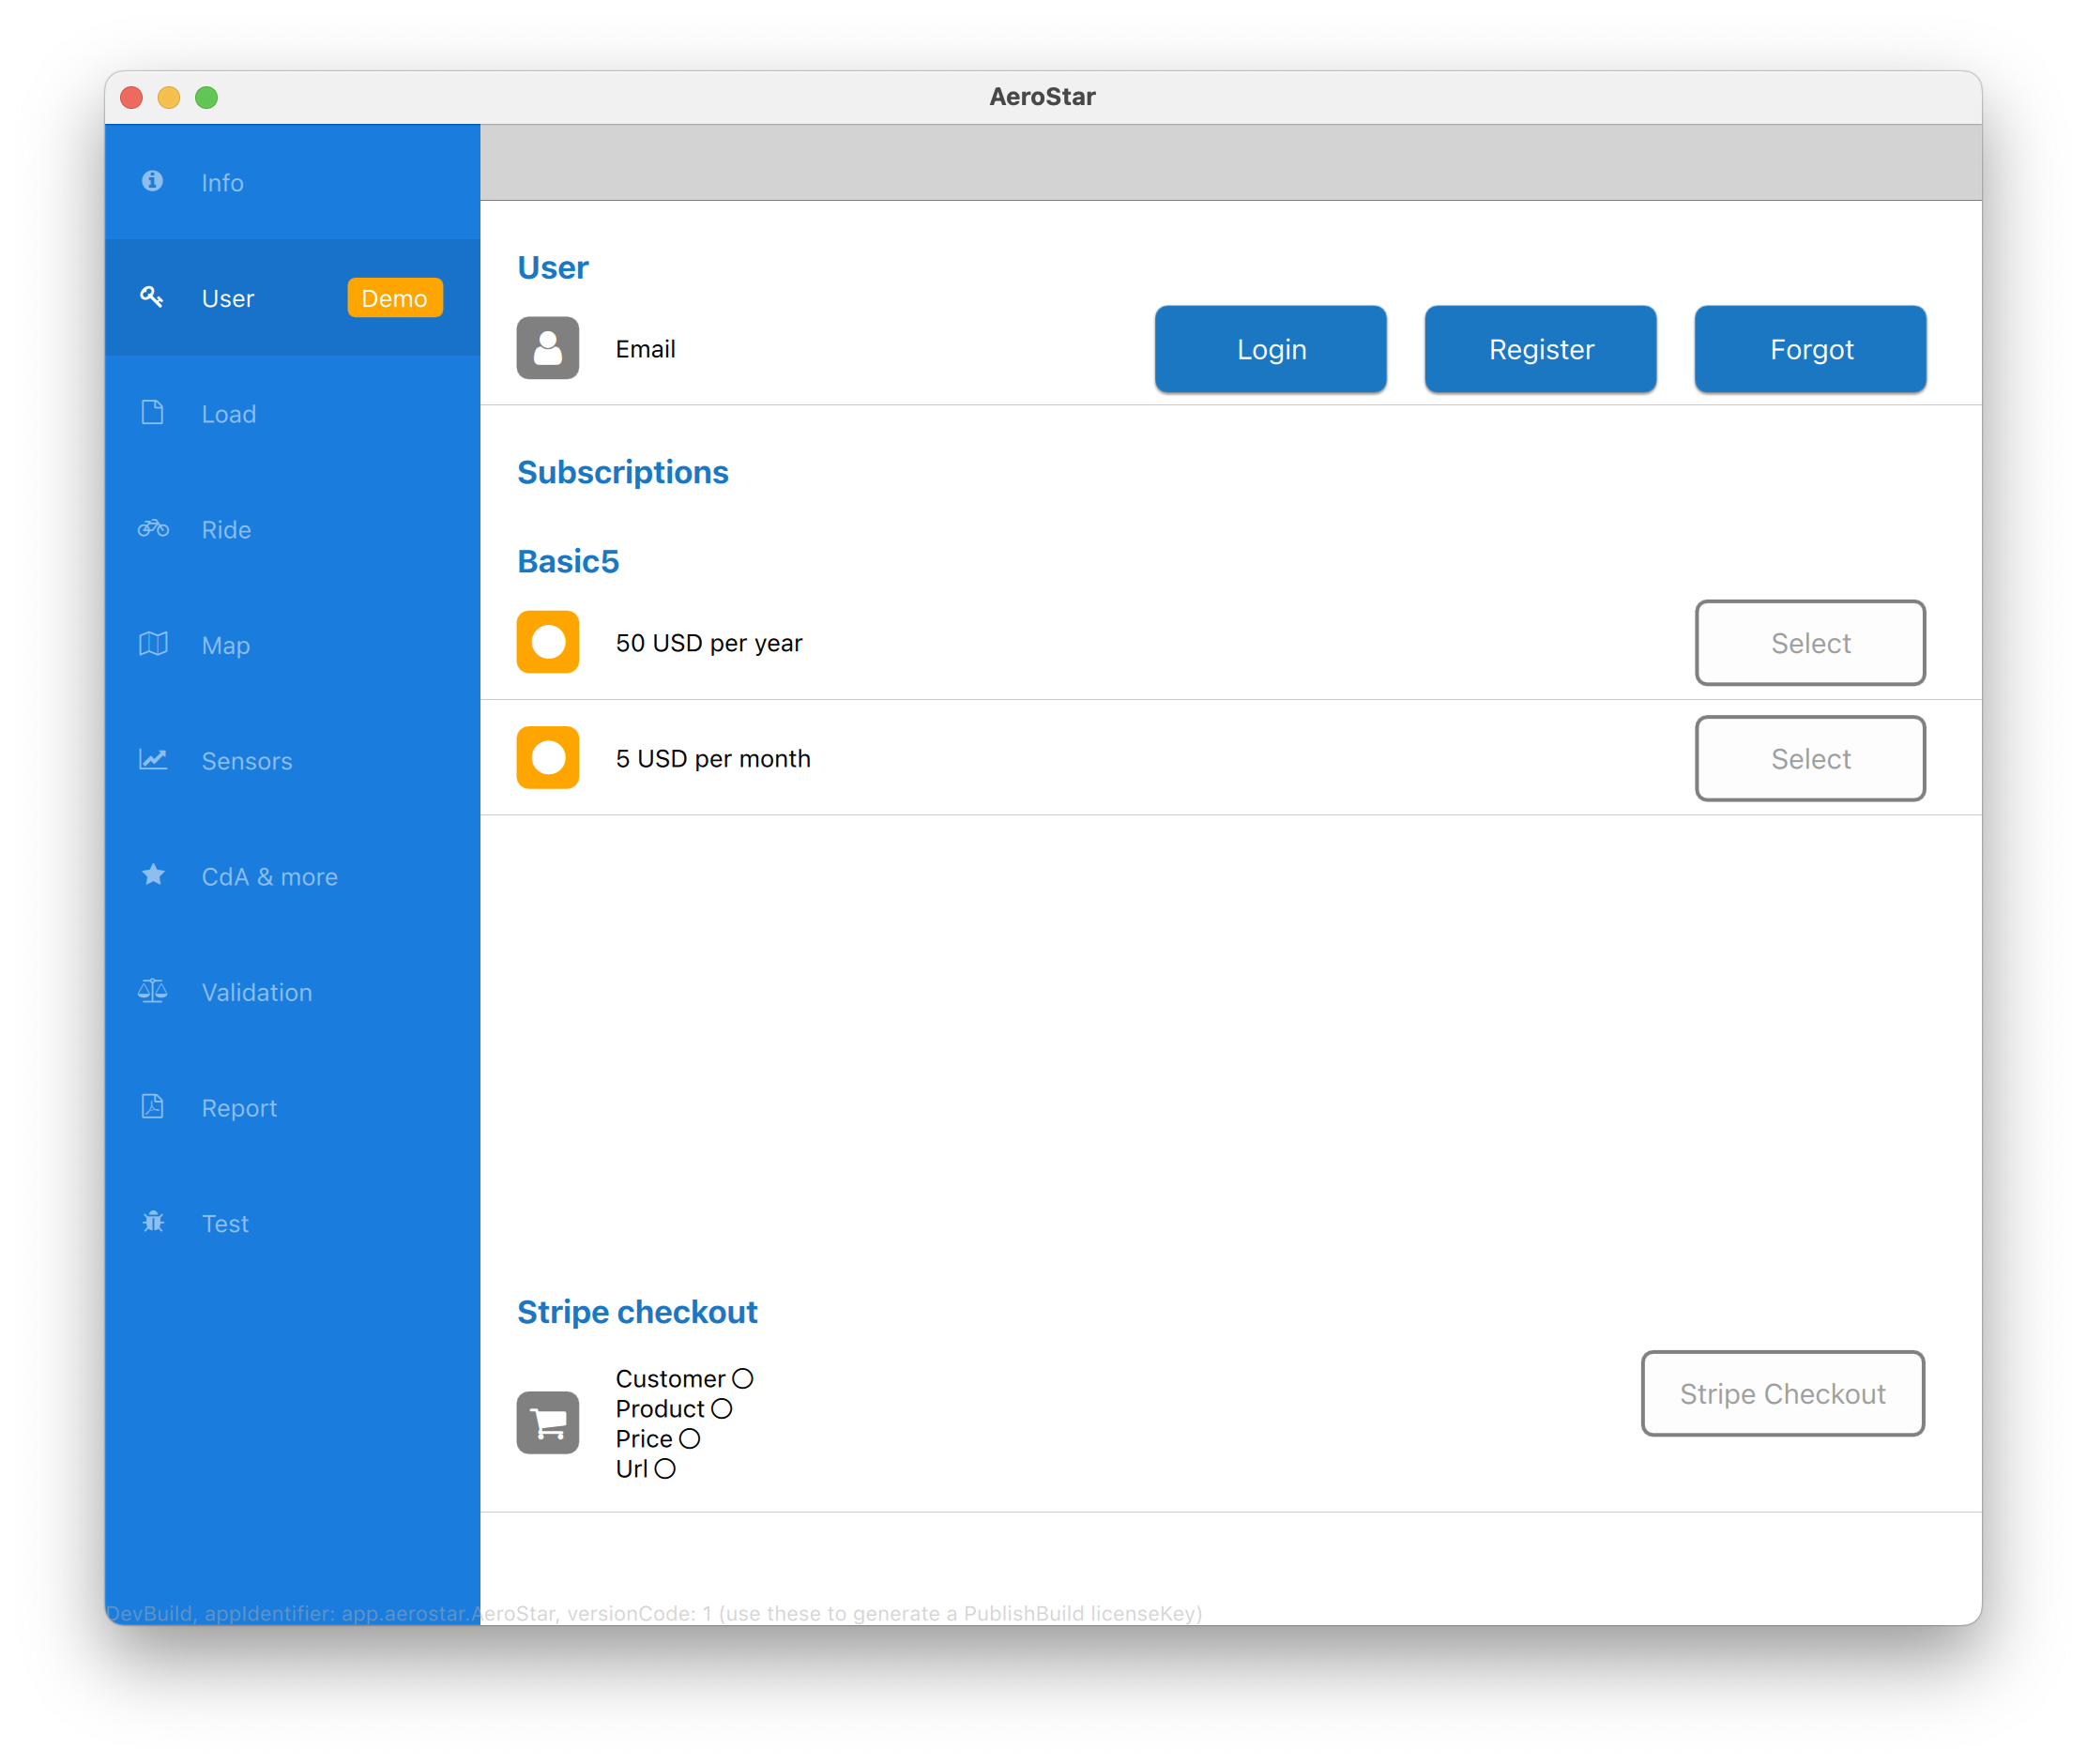
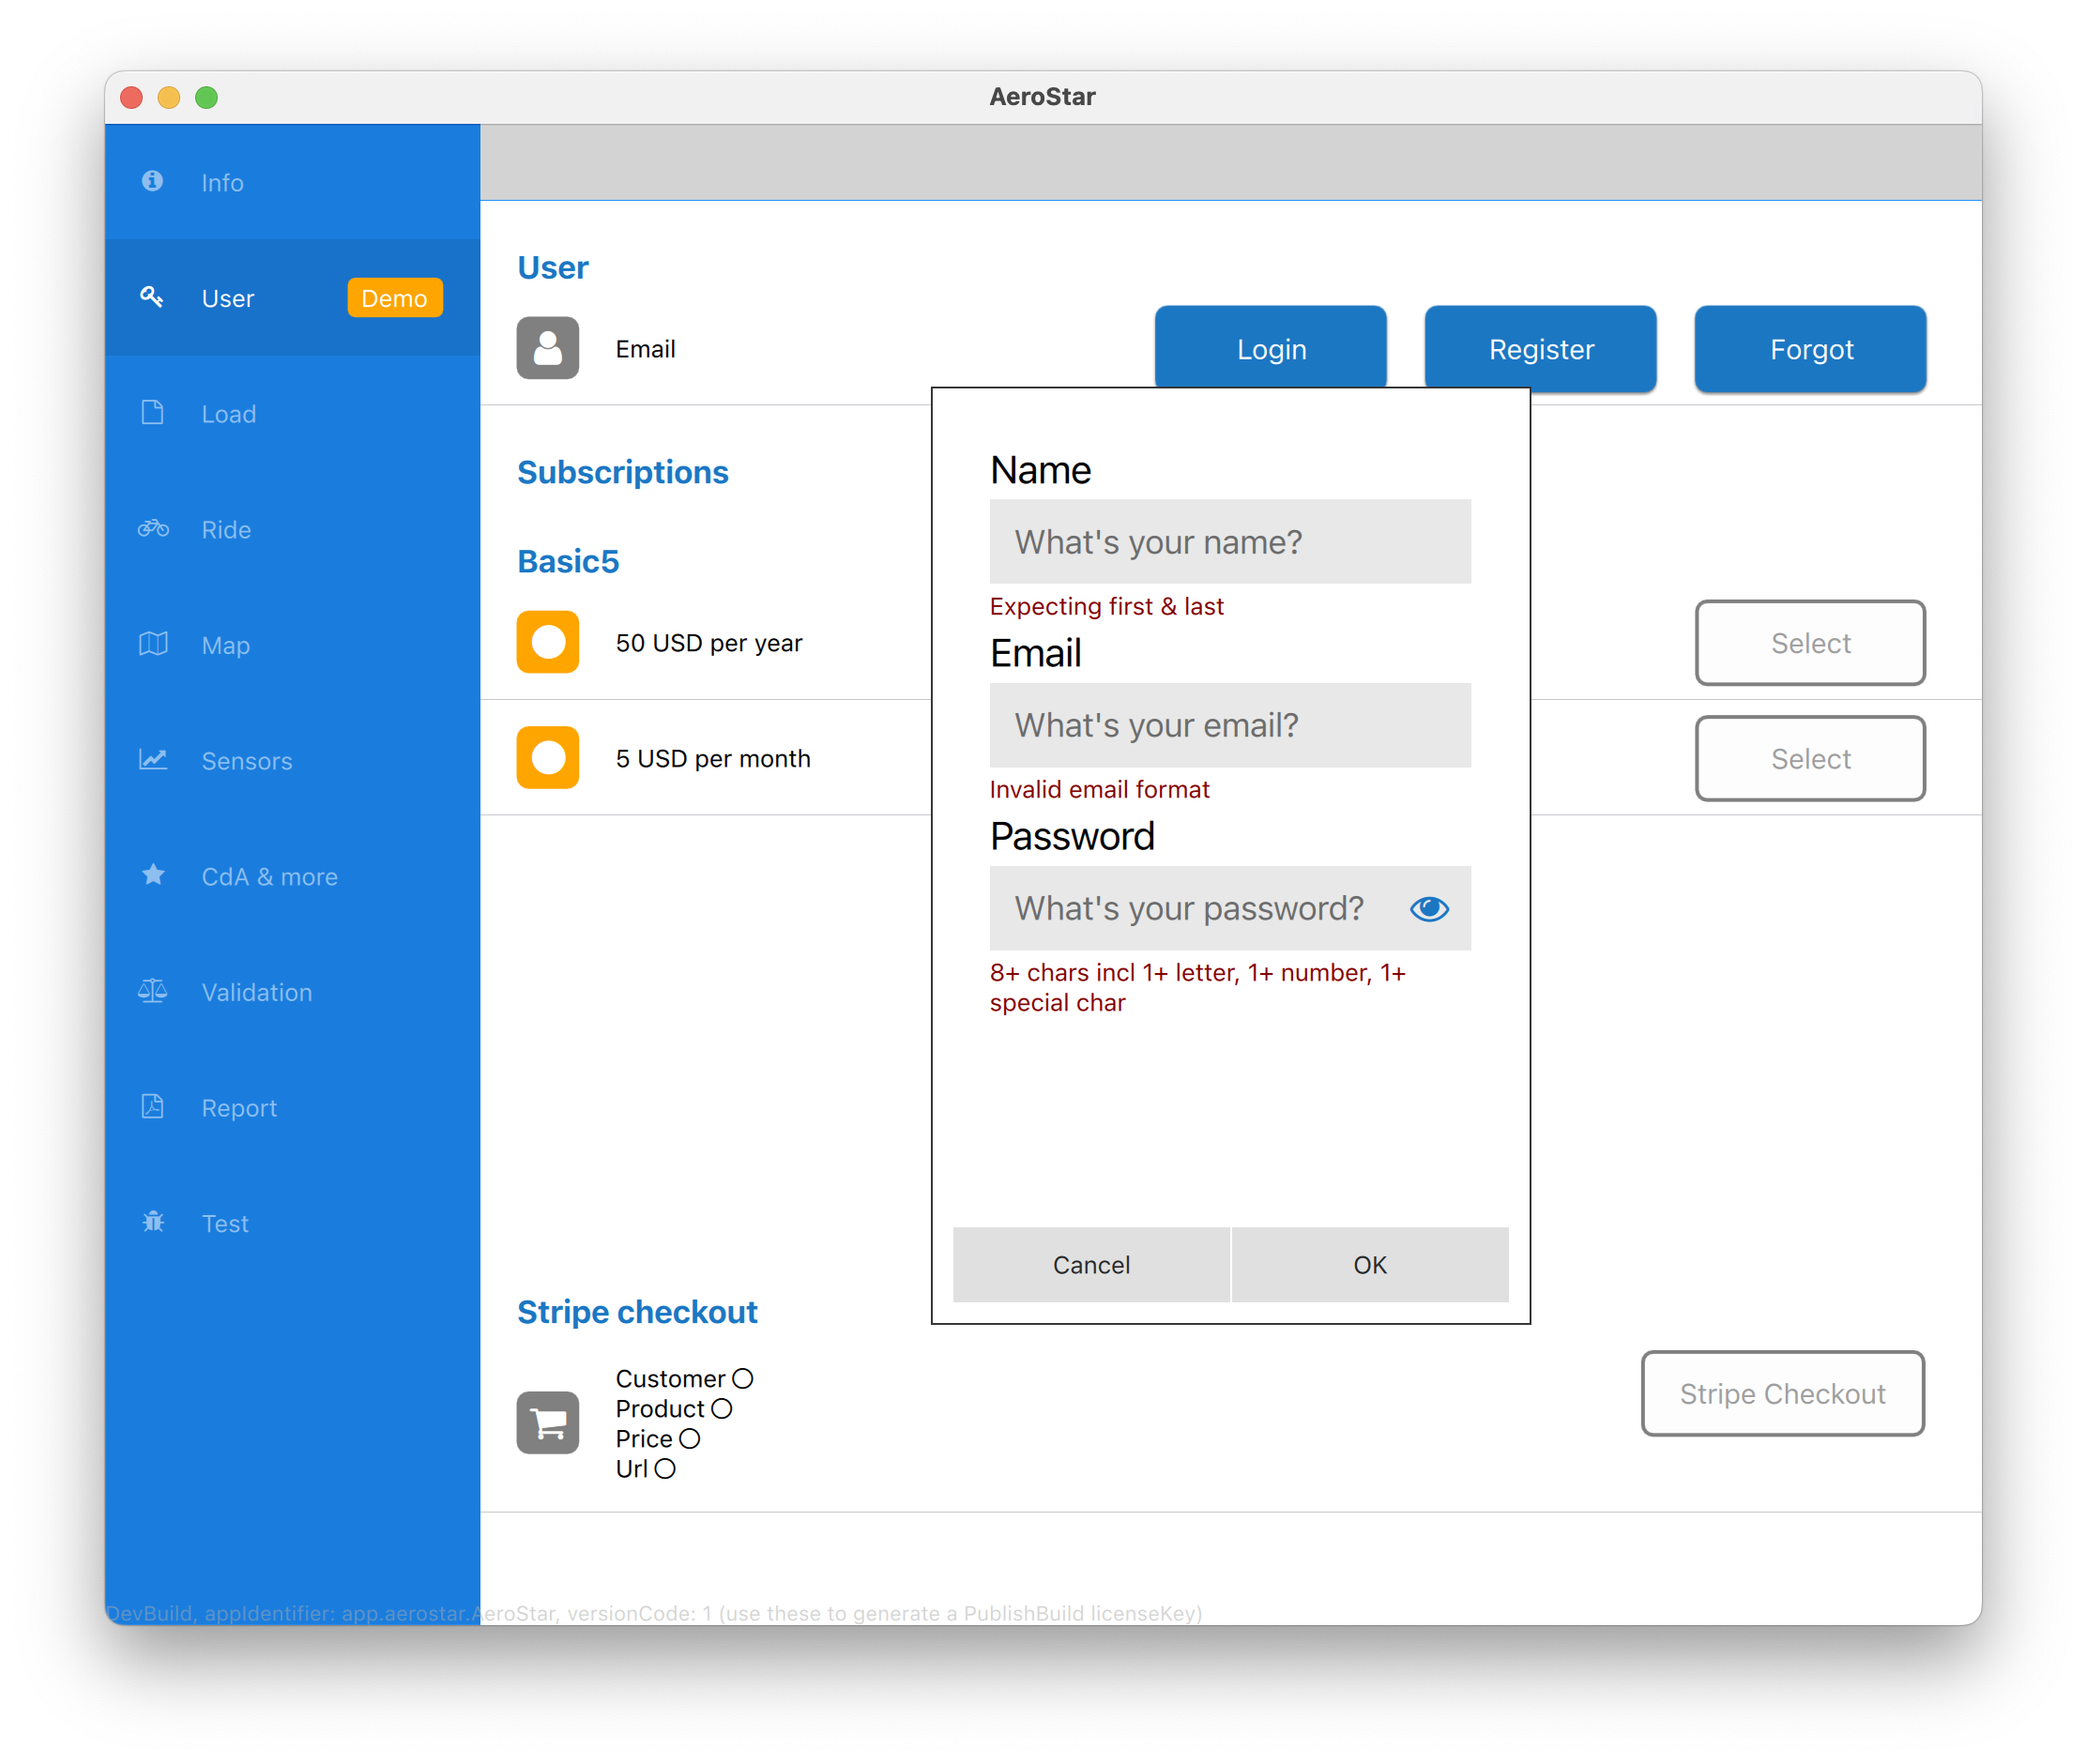
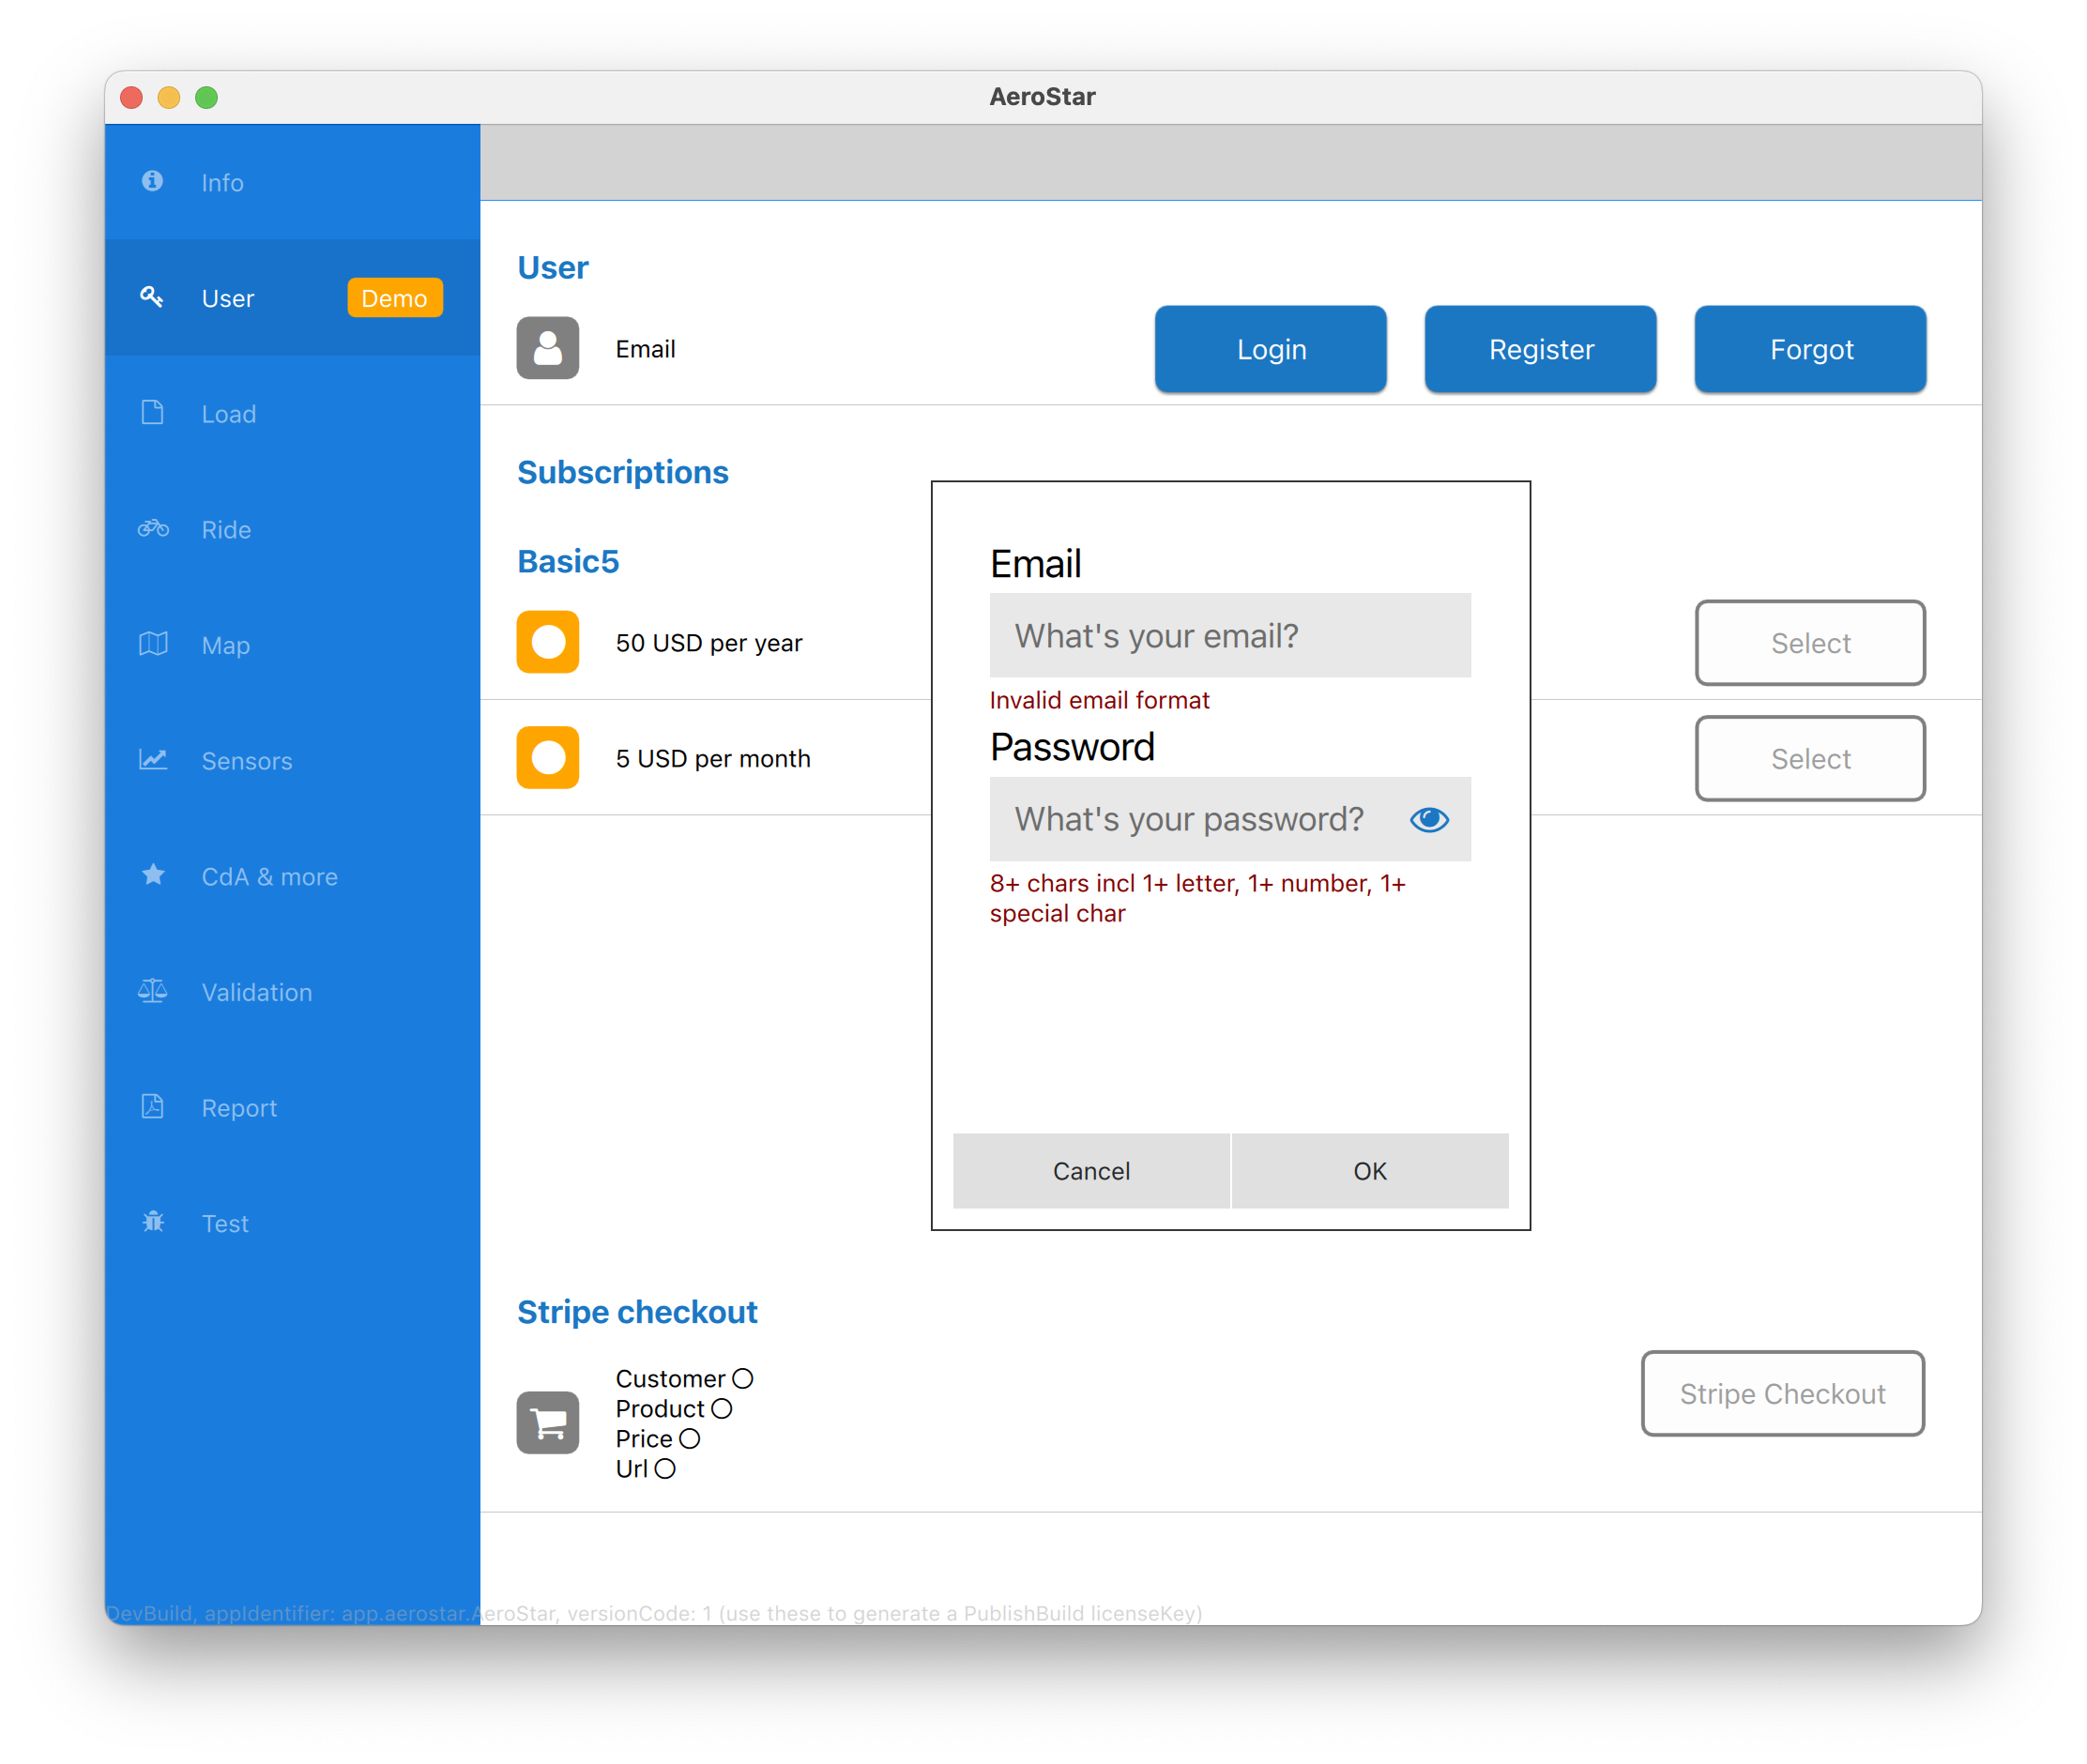
To load your own Notio file you must first register. Click the "User" tab and fill in your email and create a password.
Click the "Load" tab and then the top row "Load your own file". Select a valid Notio JSON file.
A checkmark appears to show that the ride has been loaded and analyzed.
Click the "Sensors" tab to show 2x2 graphs of the major sensors including power, elevation, ground speed and air speed. To continue click the "CdA & More" tab.
Click the "Validation" tab to show 2x2 validation graphs including Energy, Virtual Elevation, Virtual Power, and Virtual Velocity. Only the Notio results are available for non-subscribers. If the Notio VE is too high = the Notio CdA is too low, and vice versa.
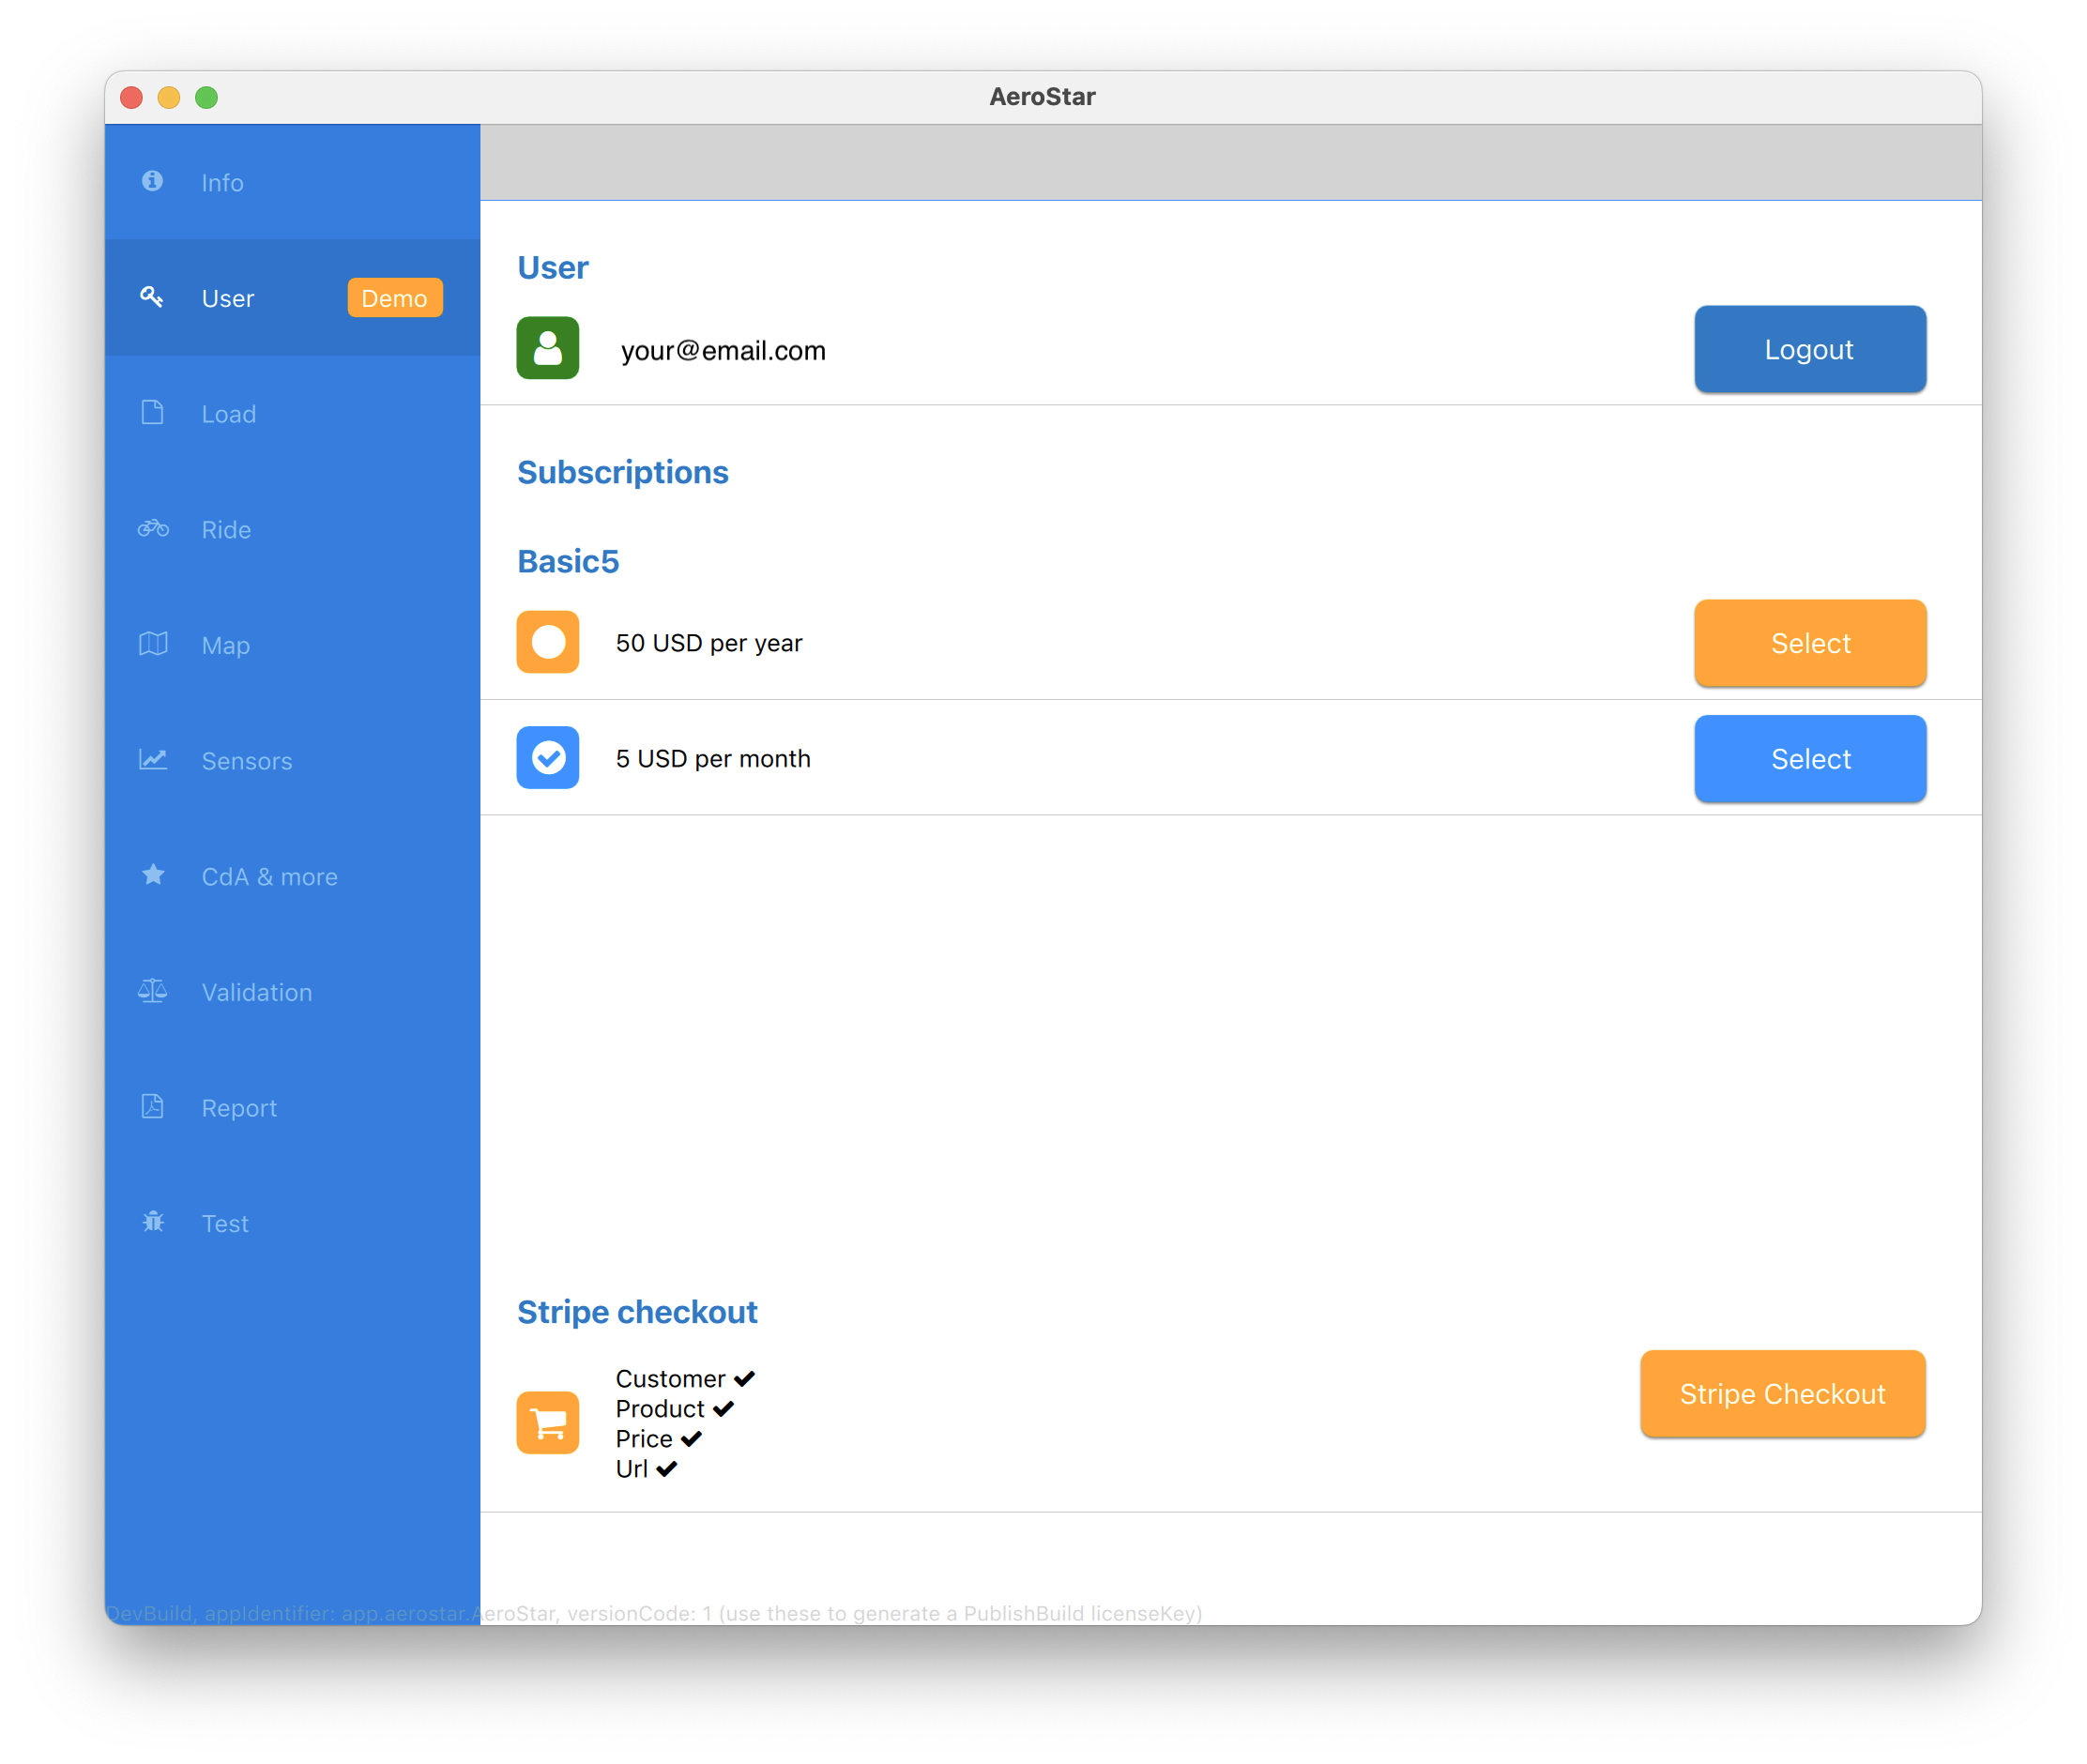
The "CdA&More" tab graphs the selected data (defaults to CdA). Only the CdA graph for Notio is shown for non-subscribers. Please subscribe to analyze your Notio ride with the Aerostar algorithms. Subscribe
After subscribing the Aerostar data and graphs are shown.
Screenshots of sample CdA & Crr analyses Screenshots
Follow along with screenshots as we run AeroStar following the suggested step-by-step instructions.